Against Malaria Foundation
Giving What We Can no longer conducts our own research into charities and cause areas. Instead, we’re relying on the work of organisations including J-PAL, GiveWell, and the Open Philanthropy Project, which are in a better position to provide more comprehensive research coverage.
These research reports represent our thinking as of late 2016, and much of the information will be relevant for making decisions about how to donate as effectively as possible. However we are not updating them and the information may therefore be out of date.
Cause Area: Malaria
Summary
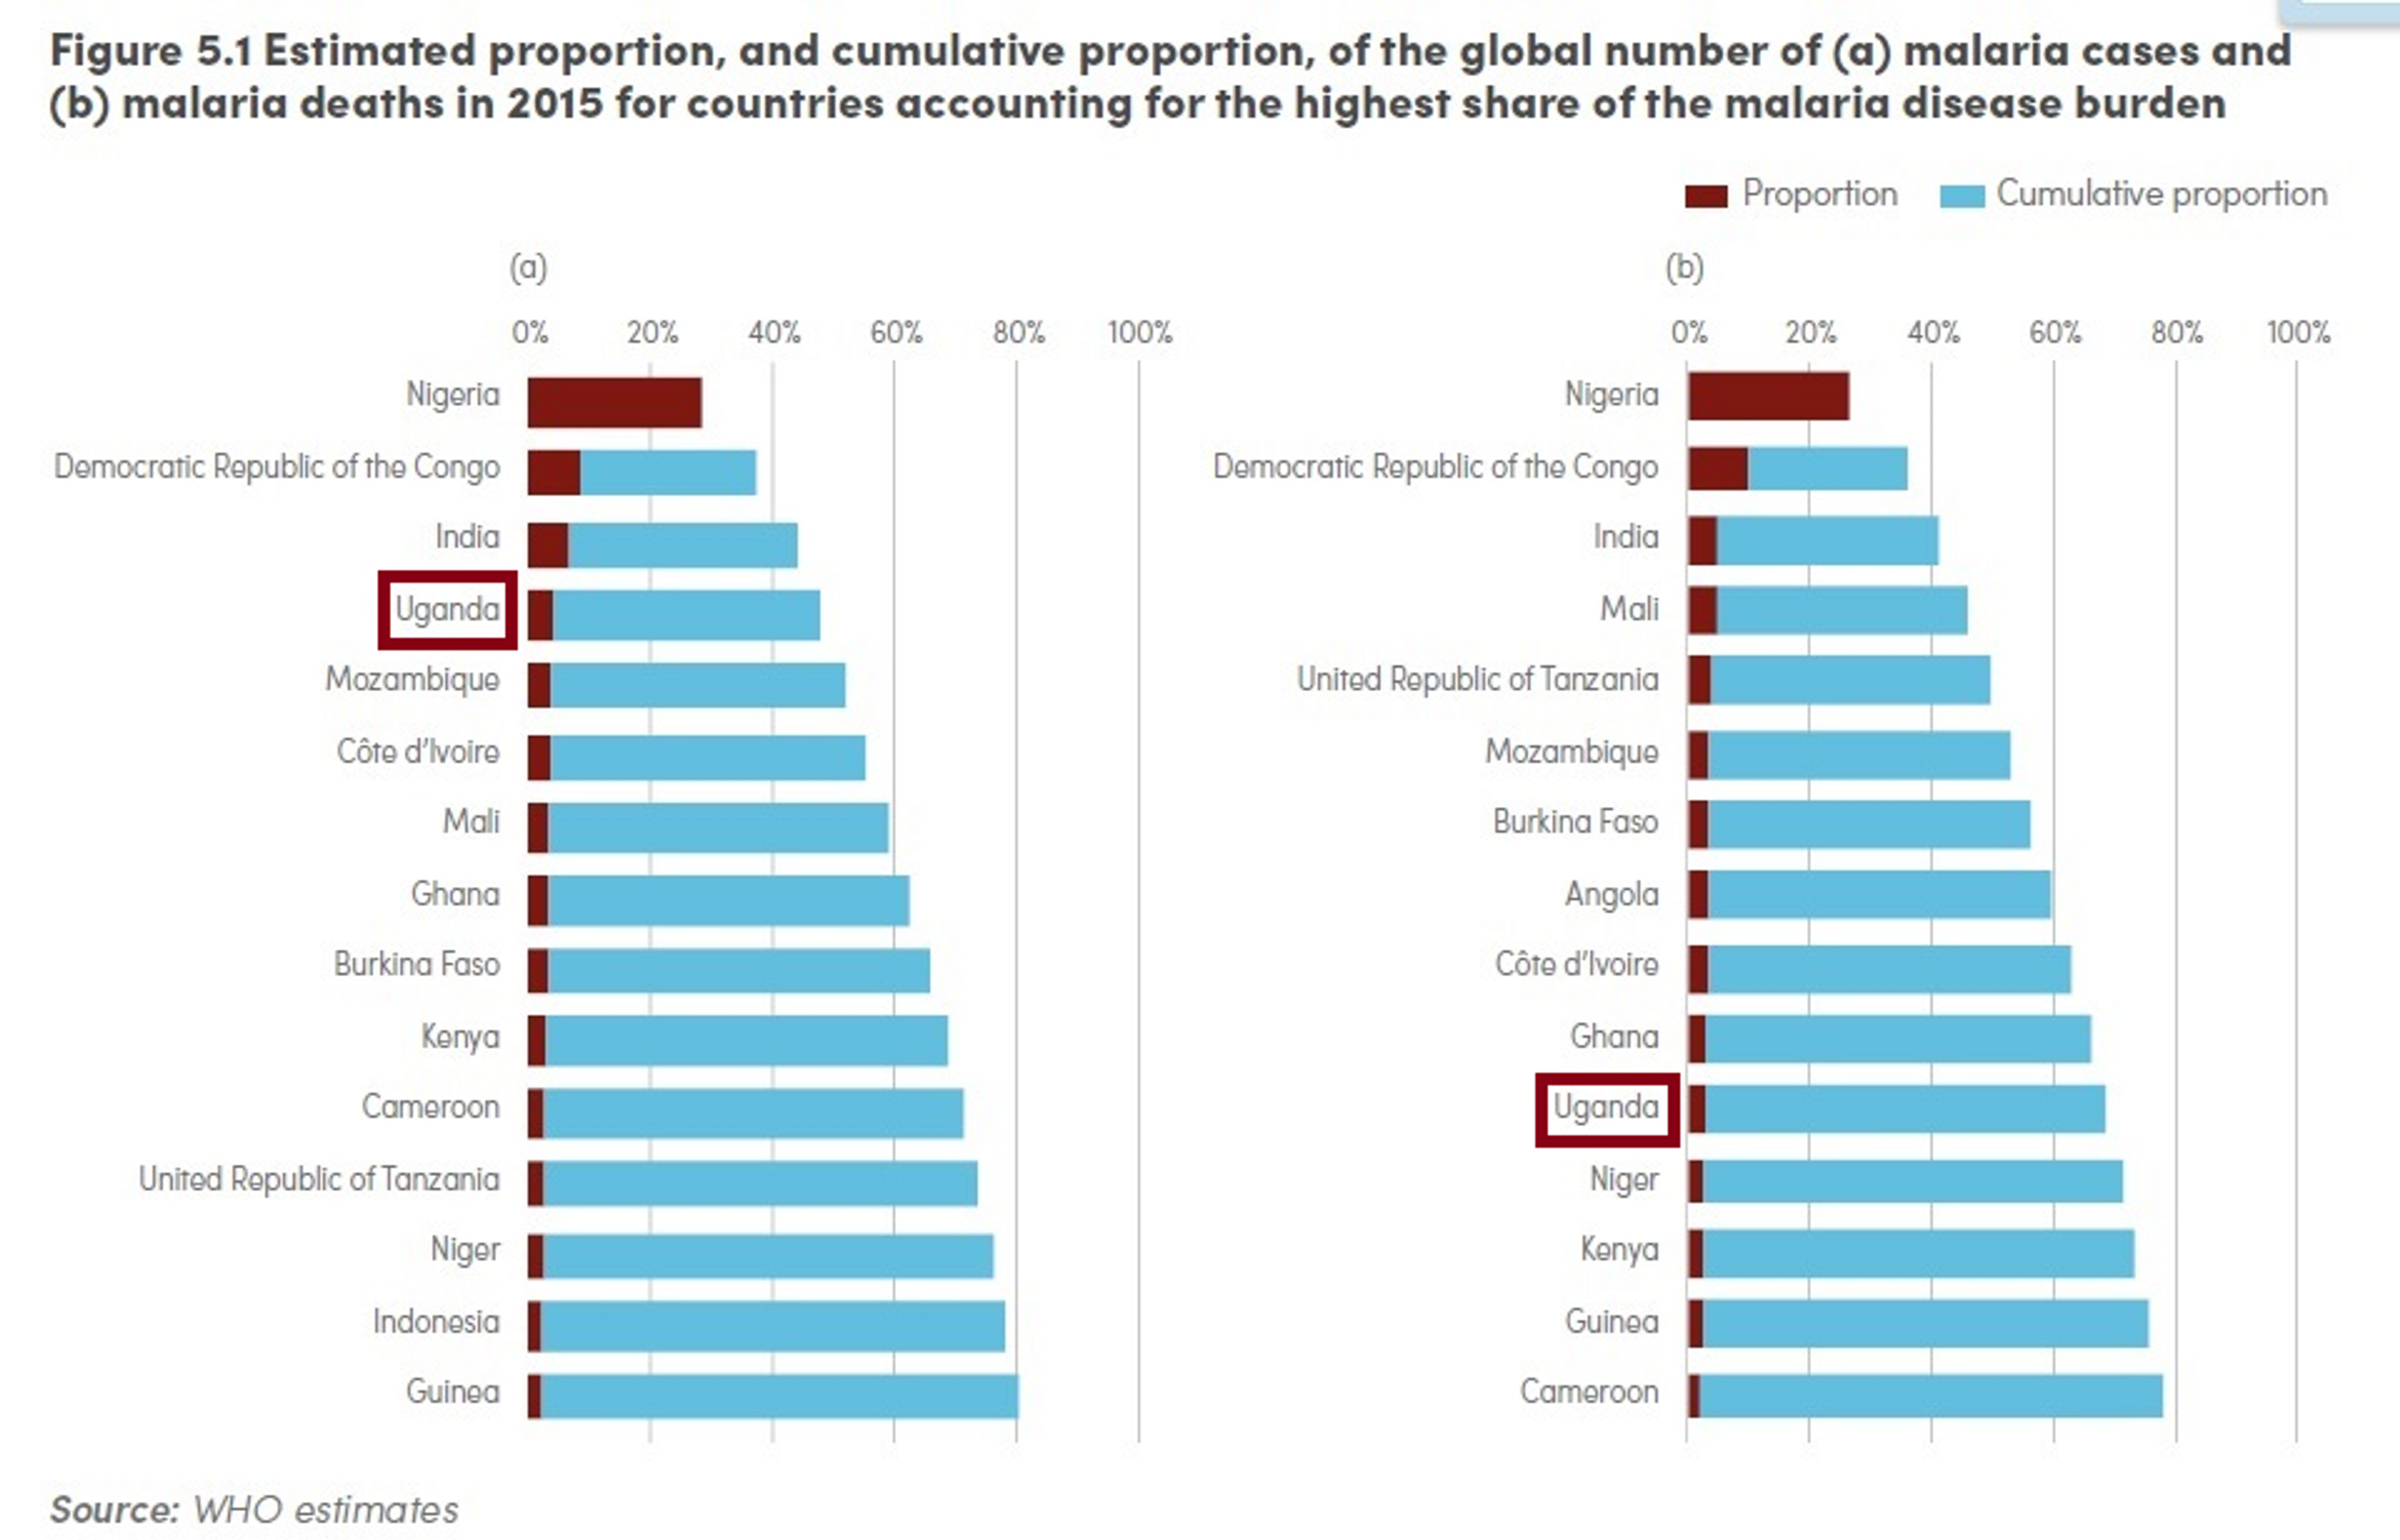
The Against Malaria Foundation (AMF) is a charity that works on malaria bed net distributions. Specifically, it identifies countries which have gaps in funding for long-lasting insecticide-treated bednets, finds partners to distribute nets to households, and then buys nets and delivers them to the distribution partners. AMF is currently working in, or has agreed to work in, Malawi, Ghana, DRC and Uganda. All these countries have high rates of the disease transmission and significant bed nets gaps. DRC, Uganda and Ghana feature in the list of the 15 countries which, according to the 2015 World Malaria Report, accounted for 80% of cases of malaria as well as the list of the 15 countries that accounted for 78% of deaths caused by malaria[^fn-1].
On average, GiveWell estimates the average cost to distribute one net is $5.311 and that every $3,461 donated to AMF prevents one death of a child under the age of 52. Donations to AMF thus avert a disability adjusted life year (DALY) i.e. enables a year in full health, for approximately $78 in expectation.
AMF’s choices for bednet distributions rely on carefully collected evidence and the organization collects detailed evidence of its activities. Distributions are made according to reliable and recent surveys of population and malaria incidence3. Follow-up surveys are conducted to record how nets are being used and what proportion of recipients are effectively protected.
AMF has a relatively strong track record in raising funds, finding distribution partners and collecting evidence on its distributions. As of May 2016, AMF has completed the distribution of 4.4 million nets. The largest distribution so far completed by AMF is the distribution of 630,000 nets in Kasai Occidental in DRC, which ended in November 20144. AMF is in the process of concluding the distribution of over 700,000 nets in Nord Ubangi, in DRC. From August 2016, AMF plans to distribute 10 million nets in Uganda.
Our estimates suggest that AMF currently has a $58,2-76,6 million funding gap. AMF has claimed that it would likely employ additional funding to offer to fill a larger portion of the funding gaps for the countries with which it is currently in discussions with. AMF’s involvement in larger distributions is attracting a growing number of funding requests, so AMF might be able to absorb a larger amount of funds in the medium term5.
AMF is an exceptionally transparent charity. All the donations received are listed on their website and donors can see where the nets that they fund are distributed. They publish the information and data associated with a distribution, including post-distribution survey information. Their annual accounts and reporting schedules can be accessed on their website.
AMF is highly specialised charity and most of its resources are employed to carry on bed net distributions. It has recently undertaken, or is considering undertaking, projects which address important challenges related to bed distributions- such as founding a Malaria Unit in Malawi, funding an insecticide resistance study in DRC and running a pilot project to test the use of smartphone technology for tracking net distributions. However, these projects are supported by bigger donors, and all donation coming in through their website will be used to buy bednets.
What do they do?
The Against Malaria Foundation’s (AMF) work focuses on the distribution of long lasting insecticide treated bed net (LLIN). Specifically, AMF does three things:
- identifies countries which have gaps in funding for LLINs;
- finds distribution partners to distribute nets to households in the countries identified; and
- buys nets and delivers them to the distribution partners.
To identify the countries with LLIN funding gaps, AMF employs a variety of sources, including: the Alliance for Malaria Prevention's (AMP's) list of countries with significant net gaps, other malaria control funders, technical advisors from the relevant countries, National Malaria Control Program (NMCP), implementing organizations, and the African Leaders Malaria Alliance6.
AMF has so far funded distributions in: Botswana, Burkina Faso, Burundi, Cambodia, Cameroon, Congo, Ethiopia, Gabon, Gambia, Ghana, Haiti, India, Indonesia, Kenya, Liberia, Madagascar, Malawi, Mali, Namibia, Nepal, Nicaragua, Nigeria, Papua New Guinea, Peru’, Philippines, Rwanda, Sao Tome and Principe, Senegal, Sierra Leone, Sudan, Tanzania, Togo, Uganda, Zambia, Zimbabwe7.
As of May 2016, AMF is in the process of working with, or has signed bednet distribution agreements with, Malawi, Uganda, Ghana and DRC. AMF has agreed to distributions in Malawi in 2018, and Uganda in August 2016. Nets have been shipped and some are already in the process of being delivered in Ghana, while a distribution is taking place in DRC. You can find more information about how malaria affects these countries and their nets requirements in the Appendix below.
AMF has worked with a variety of partners, including Concern International, Médecins Sans Frontières (MSF) Belgium, and GOAL Global in Malawi and IMA World Health, and Amani Global Works as well as the Department for International Development (DFID), the main government department responsible for administering overseas aid in the United Kingdom, in the DRC8.
AMF asks the distribution partners to do the following:
- If there are no recent data, carry out pre-distribution surveys to determine the number of nets needed. AMF support distributions aimed at universal coverage, i.e. supplying as many nets as needed so that everyone in a region is sleeping under a net, which is now considered the standard by the malaria control community910. In some countries, this is done by door-to-door surveys in every household in the district. Where possible, AMF asks for ‘105%’ data collection approach. This consists in a first round of data collection from 100% of households, followed by a second round of data collection from 5% of households, which is then compared to the original data for cross validation11.
- AMF also asks partners to send detailed reports of the distributions, including updates on the challenges faced by the partners during distributions.
- Partners are also asked to carry out post-distribution surveys to monitor the use and condition of the nets. AMF asks partners to survey 5% of households every 6 months for 2.5 years after the distribution.
- It works with local health leaders to educate populations on all elements of malaria prevention, including the correct use of malaria nets.
AMF uses the majority of to only use its fund for nets. However, AMF is flexible on this point, and it has recently also paid for non-net costs in cases in which it trusted the partners to spend the funds appropriately and report in detail.
AMF’s administrative costs are covered by established private donors, and the costs of distribution are covered by its distribution partners. This results in additional donations contributing directly to the purchasing of additional nets.
Together with distribution partner Concern Universal, AMF has founded a "Malaria Unit" in Malawi. The unit aims to pilot interventions to improve sustained net coverage levels, increase efficiency of existing operations, support the country’s National Malaria Control Programme and improve malaria case rate data collection12.
AMF is planning to fund a Liverpool School of Tropical Medicine study on insecticide resistance in DRC and to run a pilot project to test the use of smartphone technology for tracking net distributions.
Cost-effectiveness
In Malawi and the DRC, the two countries in which AMF has distributed the most nets, the estimated average cost per net distributed is $5.15 and $6.30, respectively1314. On average, GiveWell estimates the average cost to distribute one net is $4.4715.
Approximately 78% of deaths from malaria are children under the age of 516. GiveWell estimates that every $3,461 donated to interventions AMF prevents one death of a child under the age of 517. Givewell caveats that these estimates should be used with caution due to significant uncertainty around them, but that it is useful for comparative purposes and to “think through as many of the relevant issues as possible”18.
Givewell’s spreadsheet19 shows that they take the average overall costs for bednet distributions by AMF and divide them by the expected lives saved / death averted “per protected child under 5 – adjusted for today's lower rates of child mortality and insecticide resistance”. The later estimate also takes into account factors such as wastage, years of protection per person per net, and pre-existing net ownership. This calculation gives us the $3,461 per life saved / deaths averted figure.
Assuming that every $3,461 donated to interventions AMF is part of prevents one death of a child under the age of 5, these donations would avert a DALY for approximately $78 in expectation. How is this obtained? When a child under five dies, the number of years they would be expected to live on average is 76.720. However, this number is then time-discounted, to take into account various factors, including uncertainty about the future and the likely flow of benefits over time (as for instance the reduced spread of diseases21). A time discount rate of 3% for years of life lost ar employed22: discounting 76.7 years at a 3% rate gives about 36.5 years. Dividing $3,461 by 36.5, and rounding the result, we obtain $95. Note, moreover, that this figure might be an underestimate of AMF’s overall cost-effectiveness as it only includes under 5 child mortality and does not include the majority of malaria cases which are non-fatal and cases which lead to mortality in those aged 5 and over.
This figure aligns with other estimates in the literature. For instance, a 2011 article systematically reviewed the published literature on the costs and cost-effectiveness of malaria interventions. The graph below shows shows the incremental cost-effectiveness ratio (ICER) of anti-malarial interventions against deaths averted, DALYs averted and cases of malaria averted23. ICER is defined by the difference in cost between two possible interventions, divided by the difference in their effect.
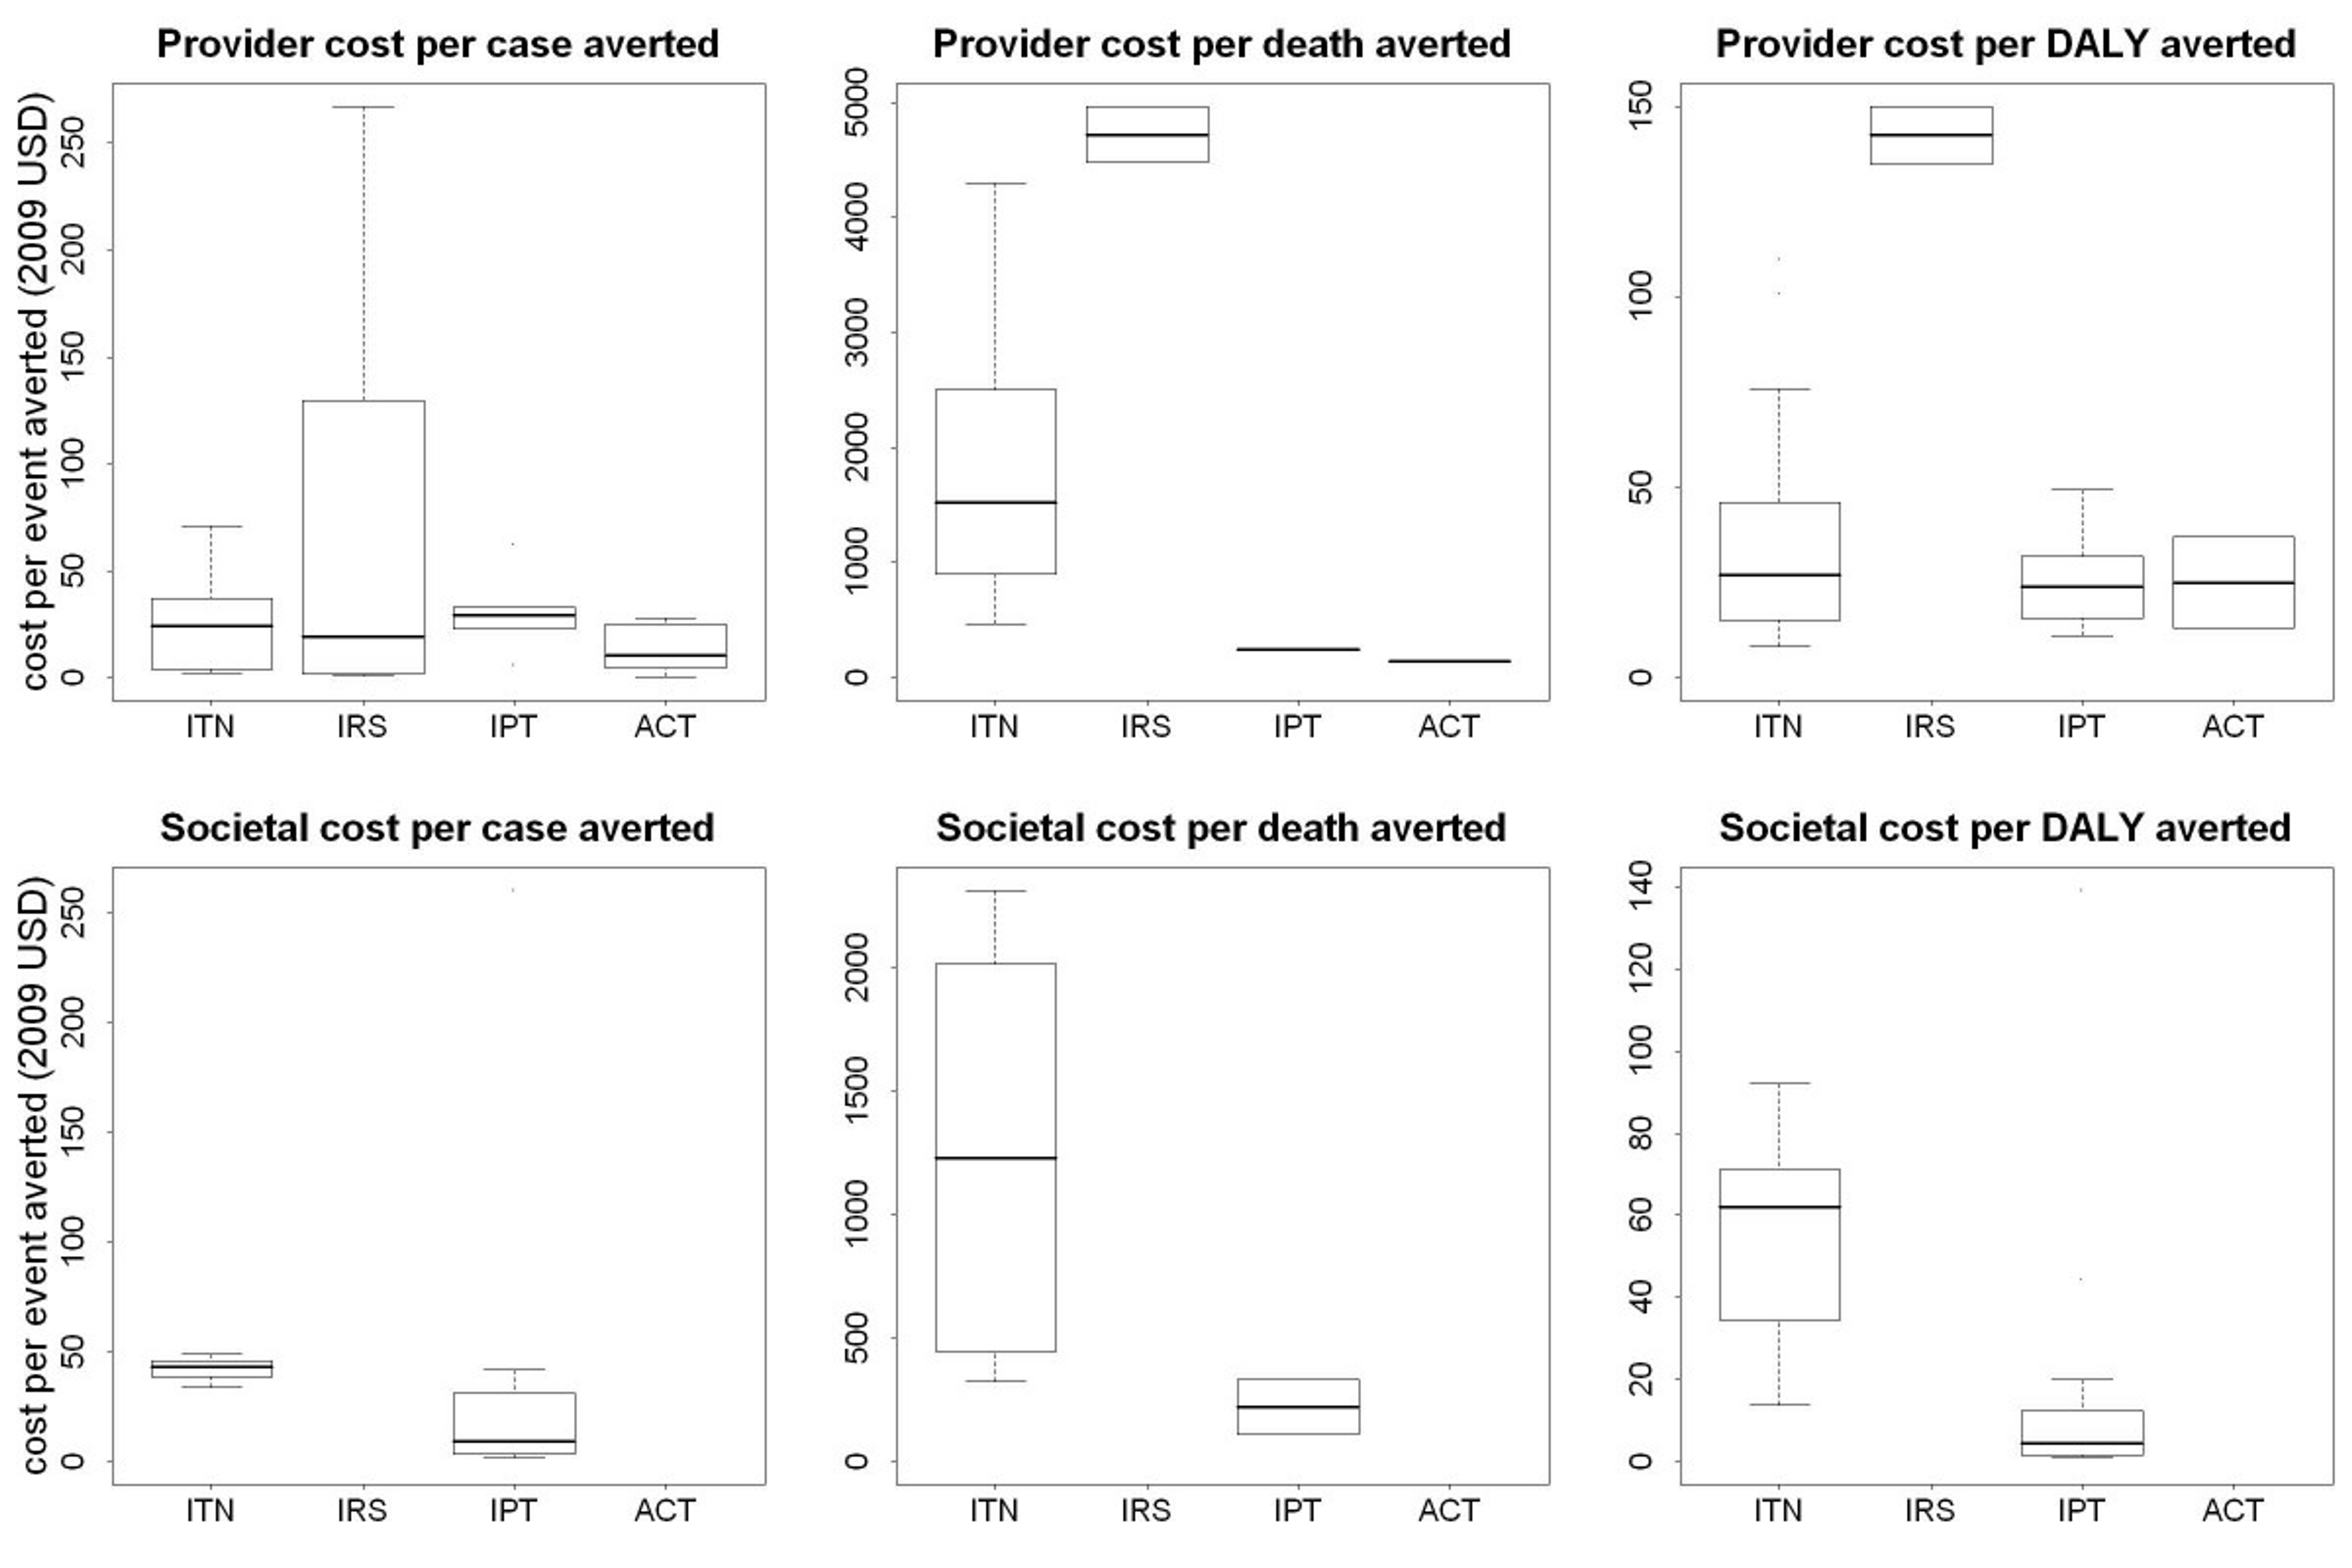
Figure 1: ICERs of anti-malarial interventions against deaths averted, DALYs averted and cases of malaria averted 24
The estimates mentioned in the literature review span from about $500 to $4000. The variation in cost effectiveness are explained by a variety of factors, including the fact that studies were undertaken at different times, differences in target populations, differences in types of nets, variation in transmission intensity, variation in delivery mechanism, and so on. It is likely that the main reason for variation in cost-effectiveness is due to variation in malaria transmission intensity. This is because, if there's more malaria in a given area, then there are more cases and deaths to avert, and hence the intervention is more cost-effective. The dependence of malaria transmission intensity as the key driver of cost-effectiveness has become more pronounced in recent years as large-scale net distributions have become increasingly efficient and optimised25.
For more information on how the GiveWell estimate of AMF’s cost-effectiveness compares to other relevant figures in the literature, see our report on malaria.
There are reasons to think that there are factors limiting the effectiveness of AMF's work. Some of them concern bednet distribution as an intervention in general: insecticide resistance, negative effects of free bednet distribution on usage and private markets, the possibility of reduced malaria immunity, bednets misuse
and diversion of skilled labor from other areas. We address these concerns at a general level in our report on malaria and conclude that bednet distribution do not have a substantial disruptive effect on the wider economic and health system. Here we outline further reasons to think AMF is especially well-placed to address these worries.
Insecticide resistance is a serious and pressing concern. Out of 78 countries that reported data since 2010, 60 reported resistance to at least one insecticide in one malaria vector from one collection site, and 49 reported resistance to insecticides from two or more insecticide classes2627. This worry is taken very seriously by AMF and, as we noted above, the organization is planning to fund a study on insecticide resistance in DRC, run by the Liverpool School of Tropical Medicine. AMF has recently agreed to fund the distribution of over 10 million nets in Uganda. Part of these nets will be LLINs treated with a pyrethroid insecticide and the synergist piperonyl butoxide (PBO), since evidence suggests this type of net might be more effective against mosquitoes developing resistance to pyrethroid (the insecticide generally employed on LLINs; or more details, see the section on Track Record below).
It has been hypothesized that people who purchase nets will use them more than those who receive them for free and thus that free bednet distributions are not as good as selling them. Moreover, in the last years, a few reports have suggested that bed nets had been used for fishing282930 and a 2015 article in the New York Times31 “claimed countless [people in Africa] are not using their mosquito nets as global health experts have intended”, most often for fishing, which causes harm to fish stock due to the nets insecticides and fine gauges32. AMF takes this concern seriously and takes several steps to prevent net misuse, including malaria education, pre-distribution surveys to determine precise net needs, post-distribution check-ups to ensure nets are being used as intended every 6-months. Results of the post-distribution surveys suggests nets are in fact mostly used for their intended purpose (for more information on post-distribution survey results, see below).
Some worry that providing free bednets disrupts local net markets, affecting the livelihood of those surviving on those sales. AMF has commented on this problem by stating that, though their priority is to buy the most nets possible for the funds available, they keep a close eye on local-sourcing options and where it is 'near-economic' to buy nets from local retailers, they do so33.
Other concerns about AMF effectiveness are not rooted in general worries about bed net distributions, but rather concern the organization’s activities in particular. One might worry that bed net distribution diverts skilled labor from other areas. However, AMF bednet distribution is normally undertaken with the assistance of low level government officials (rather than the limited supply of skilled medical practitioners) and completed within a week34. We do not believe that the diversion of skilled labor is significant.
Another possible worry concerns displacement: it might be that AMF funding for nets is displacing funds from other sources, such as government health funds and the Global Fund. It is difficult to estimate whether or not this is the case for each distribution funded by AMF. However, two points are relevant to this concern. First, estimates suggest that there is a large global gap of bednets: for instance, the bed net gap in Sub-Saharan Africa in 2016 is estimated to be at least 64 million35. Secondly, AMF has stated that, when it does not end up funding a distribution it had planned to fund, the gap is not always filled by another funder in a short time. For example, the funding gap might be filled only in part, sometimes distributions are delayed (in some cases for over a year) or do not in the end occur36.
Robustness of evidence
The evidence that mass bed net distributions prevent malaria related deaths and ill health is exceptionally strong. We review this evidence in detail in our malaria report. In brief, there are more than 20 randomized controlled trials that show that malaria net distributions reduce infant mortality and hundreds of other studies published in the peer reviewed literature on issues regarding bednet distributions.
On the organisational level, AMF’s carefully collects detailed evidence of its activities and based its choices on those. Distributions are made according to recent surveys of population and malaria incidence37, which is the main predictor of bednet effectiveness. Follow-up surveys are conducted to record how nets are being used and what proportion of recipients are effectively protected. In Ntcheu (Malawi) the coverage rates for the 6, 15 , 24 and 33- month follow up surveys were respectively 90%, 84%, 79% and 56%. In Balaka (Malawi), the coverage rates for the 6 and 14 month surveys were respectively 90% and 73%. The 8 month review in Dedza (Malawi) showed a 82% coverage rate38.
Track record
AMF has a relatively strong track record in raising funds, finding distribution partners and collecting evidence on its distributions. As of May 2016, AMF has completed the distribution of 4.4 million nets. The largest distribution so far completed by AMF is the distribution of 630,000 nets in Kasai Occidental in DRC, which was completed in November 201439. AMF is in the process of concluding the distribution of over 700,000 nets in Nord Ubangi in DRC and over 10 million nets in Uganda.
AMF has agreed to fund 2.7 million nets in Ghana which are to be distributed between June and July 2016. AMF is funding the costs of the nets and AMF’s additional monitoring costs, and the Global Fund agreed to fund other non-net costs.
The largest distribution confirmed by AMF will take place in Uganda between August 2016 and March 2017 and it will comprise 10,743,120 nets, which will cost approximately US$ 26.4 million for bednet costs. This is half the nets needed for the nationwide universal coverage campaign. Non bednet costs (shipping, pre-distribution, distribution) will be funded by the Ugandan Government and other partners. The pre-distribution registration process will employ the ‘105%’ data collection method and data will be put in electronic form. AMF will fund follow up checks to be held every six months for two and a half years follow. Part of the nets funded by AMF will be LLINs treated with a pyrethroid insecticide and the synergist piperonyl butoxide (PBO). Some evidence suggests this type of net might be more effective against mosquitoes developing resistance to pyrethroid (the insecticide generally employed on LLINs)4041. The AMF distribution in Uganda will be the first large-scale distribution using the new type of LLINs42.
In Malawi, a large scale distribution of 396,000 nets was planned in in January-February 201543. Incidentally, during this time, Malawi has experienced the worst floods in 50 years with at least 174,000 people have been displaced44. AMF reports that they allocated a further 150,000 LLINs to support an immediate flood-related emergency need in Malawi45, because there is increased malaria prevalence after heavy rains. One might argue that AMF is in a unique position to build up larger reserves to deliver emergency assistance in this kind of situation and this should be taken intoaccount when assessing the organization’s room for additional funding.
Room for more funding
Short-term
As of November 2015 AMF had reserves for $18.6 million46. It then received $22.8 million from Good Ventures in December 201647, bringing the organization’s funds to $41.4. However, it already allocated a substantial amounts of the funds since it agreed to fund the 2.7 million nets in Ghana (assuming the average cost of $2.50 a net, this would entail an expense of approximately $6,75 million) and roughly 10.7 million nets in Uganda ($26.448), for a total of $33.15. This leaves AMF with around $8.25 million in reserves.
It is difficult to estimate AMF’s need for more funding. In November 2015, AMF wrote that it needed $99.6 million for the projects it was then assessing. At the end of 2015, following conversations between GiveWell and AMF, the charity evaluator estimated that AMF would need about $118 millions. Considering the funds spent and fundraised at the beginning suggests it would now have a $58,2-76,6 million funding gap. However, the distributions agreed in Ghana and Uganda might have ended up being more or less expensive than originally estimated and this could have changed the charity’s estimate of its funding gap.
AMF has claimed that it would likely offer additional funding to fill a larger portion of the funding gaps for the countries with which it is currently in discussions with. It is also helpful to stress that there is reason to think that, in the long run, AMF is likely to be able to absorb a substantially larger amount of funds, since its involvement in larger distributions is attracting a growing number of funding requests (see section below)49.
Long-term
One factor that affects AMF’s room for more funding in the long run is the global funding gap for bednets. This is not easy to estimate, but evidence suggests that, at the minimum, in 2016 there is likely to be a gap of about 60 million nets (which equates to 343 million dollars). However, the gap could be much larger, since estimate vary considerably: for instance, for 2015, the Roll Back Malaria estimated a gap of around 39 million nets, while the WHO estimated a gap of about 146 million nets50.
AMF has been criticized by Givewell for not expanding their small team consisting of only three full time staff that are assisted by volunteers - which might limit their ability to raise funds as effectively as it potentially could. We have talked to AMF about this issue51 and learned that they are thinking about expanding their team in the near future, but do not need more staff at this point. AMF does try to raise funds from private donors and is planning to intensify their fundraising efforts in the future. They have also tried to work with an experienced grant writer in the past, but did not find this as effective as other means of raising funds.
Transparency
AMF is an exceptionally transparent charity. They list all the donations received and donors can see where the nets they fund are distributed. They publish the information and data associated with a distribution, including post-distribution survey information. Their annual accounts and reporting schedules can be accessed on their website.
Fungibility
AMF is highly specialised charity working only on bed net distribution. Most of its funds are employed to buy nets and deliver net to distribution partners, and, when needed, to pay for non-net costs, such as follow-up surveys. AMF has recently undertaken, or is considering undertaking, projects which focus more broadly on malaria prevention- such as founding a Malaria Unit in Malawi and, funding a resistance study in DRC, and running a pilot project to test the use of smartphone technology for tracking net distributions. We believe that these are welcome additions to AMF portfolio, since they leverage AMF’s expertise to address important challenges related to bed distributions.
Appendix
DRC
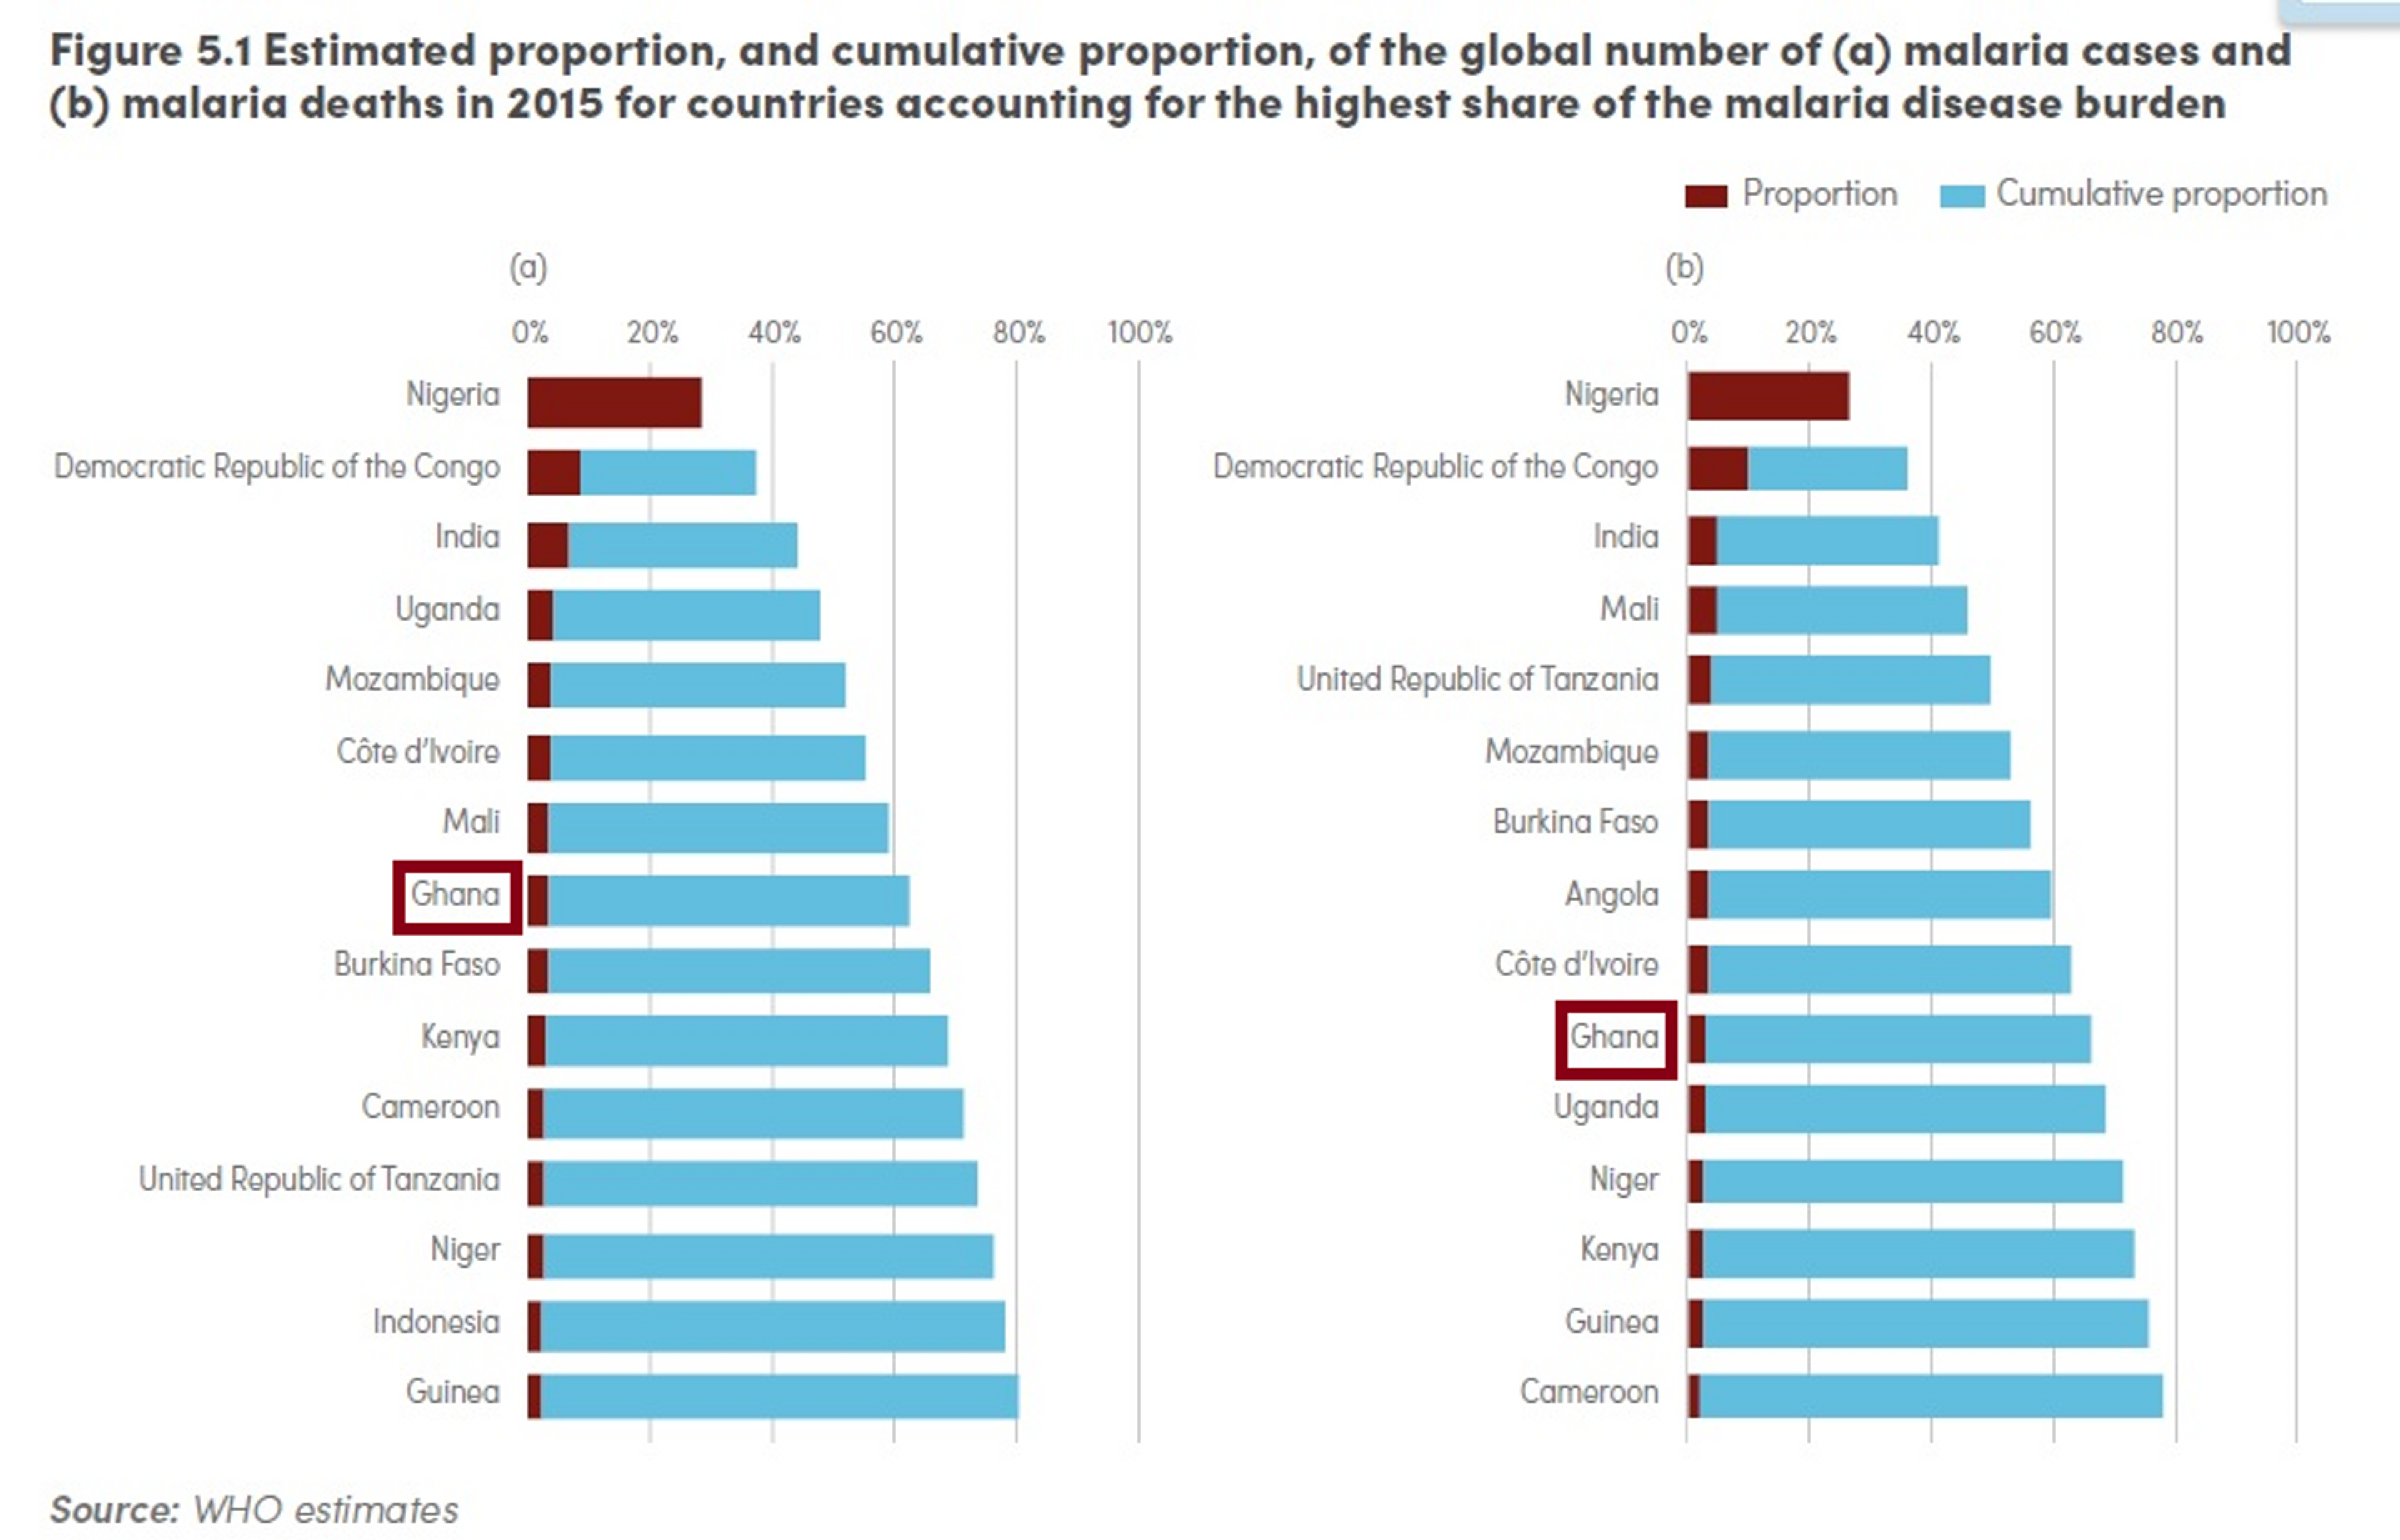
The 2015 World Malaria Report estimated that 15 countries accounted for 80% of cases, and 15 countries accounted for 78% of deaths52. DRC features in both lists and accounts for around 10% of the global malaria deaths in 2015 (see figure below).
In 2014 there were 9,968,983 reported cases of malaria and 25,502 reported deaths due to the disease53. It should be stressed that this number refers to reported cases: the actual number is likely to be much higher, since malaria cases and deaths are likely to be under-estimated and under-reported.
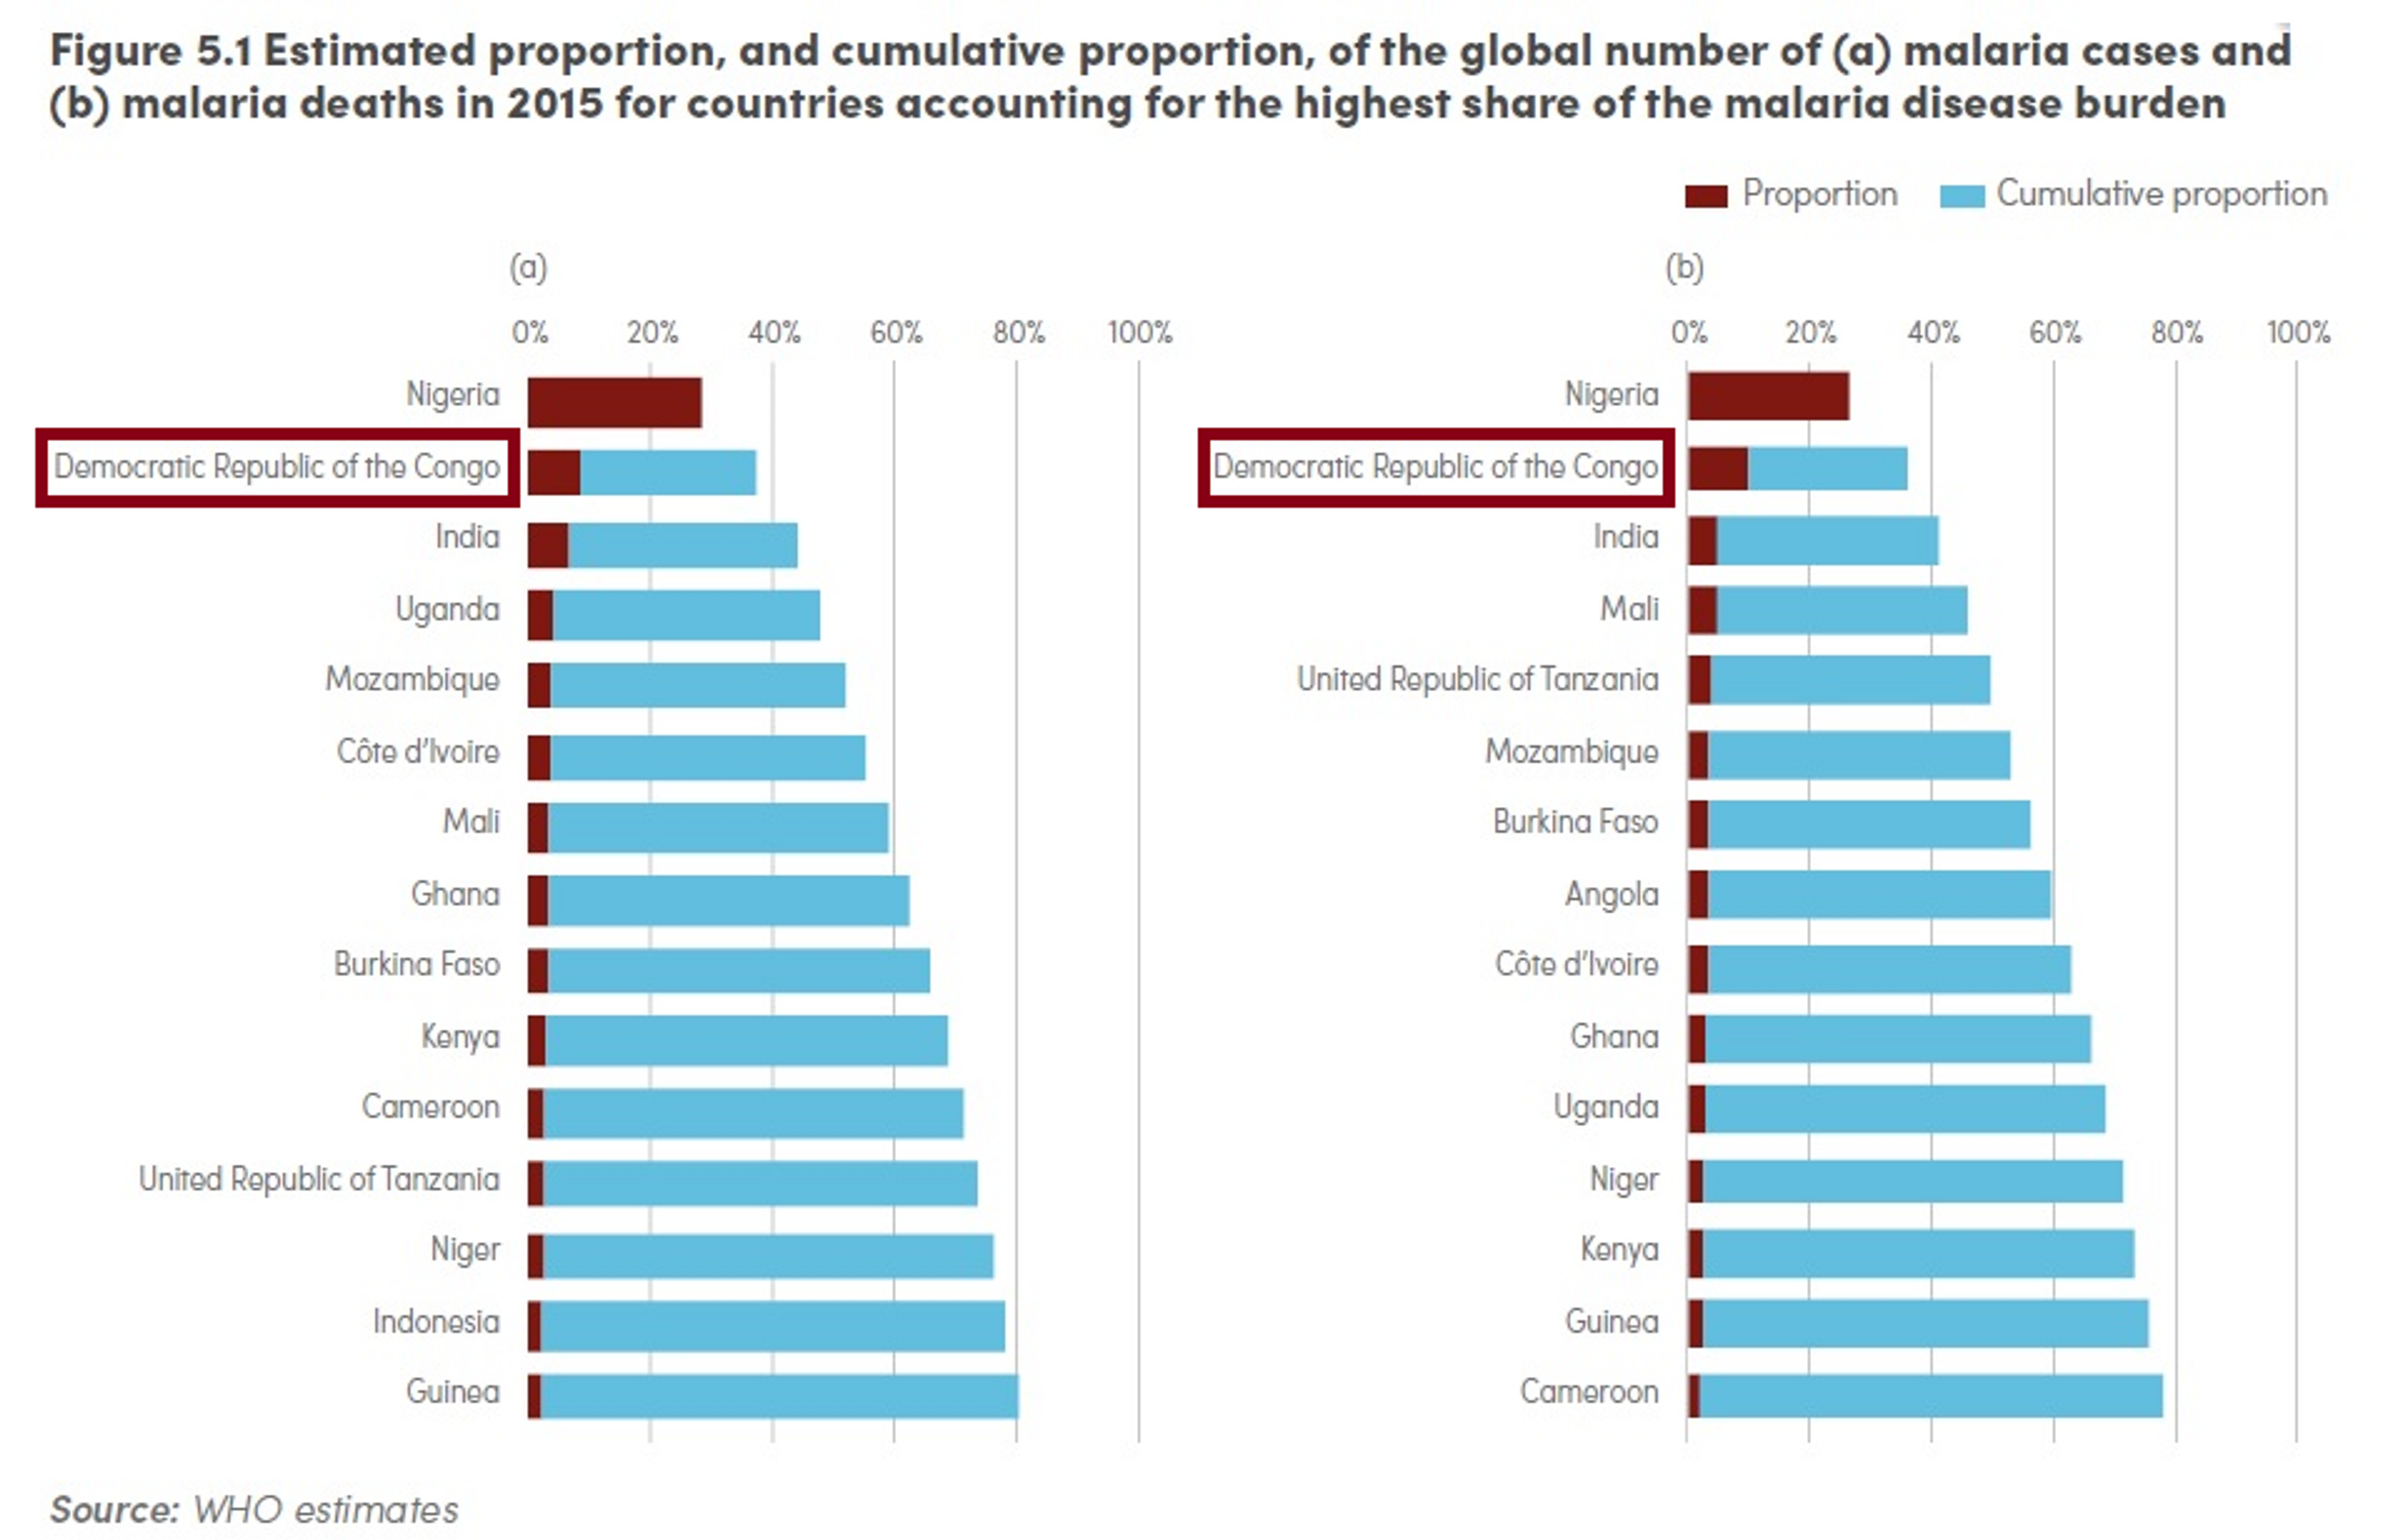
Source: World Malaria Report 2015
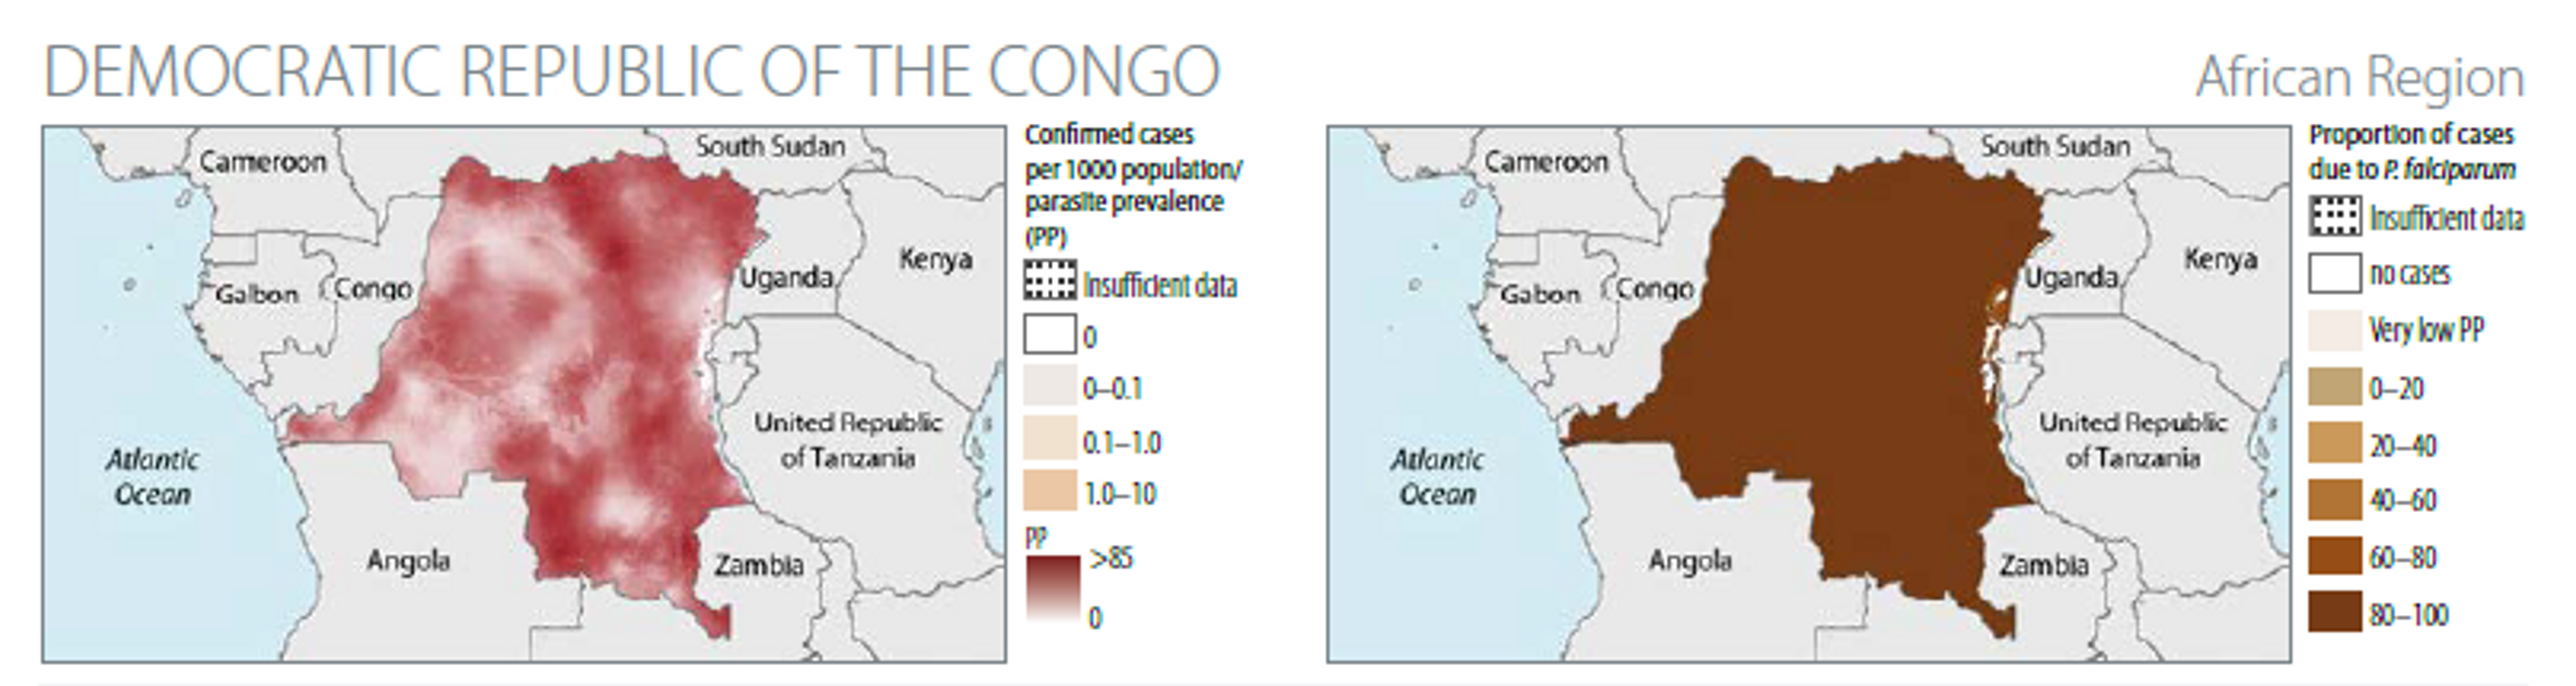
The rate of the disease transmission is high (>1 case per 1000 population) for 97% of the population54.
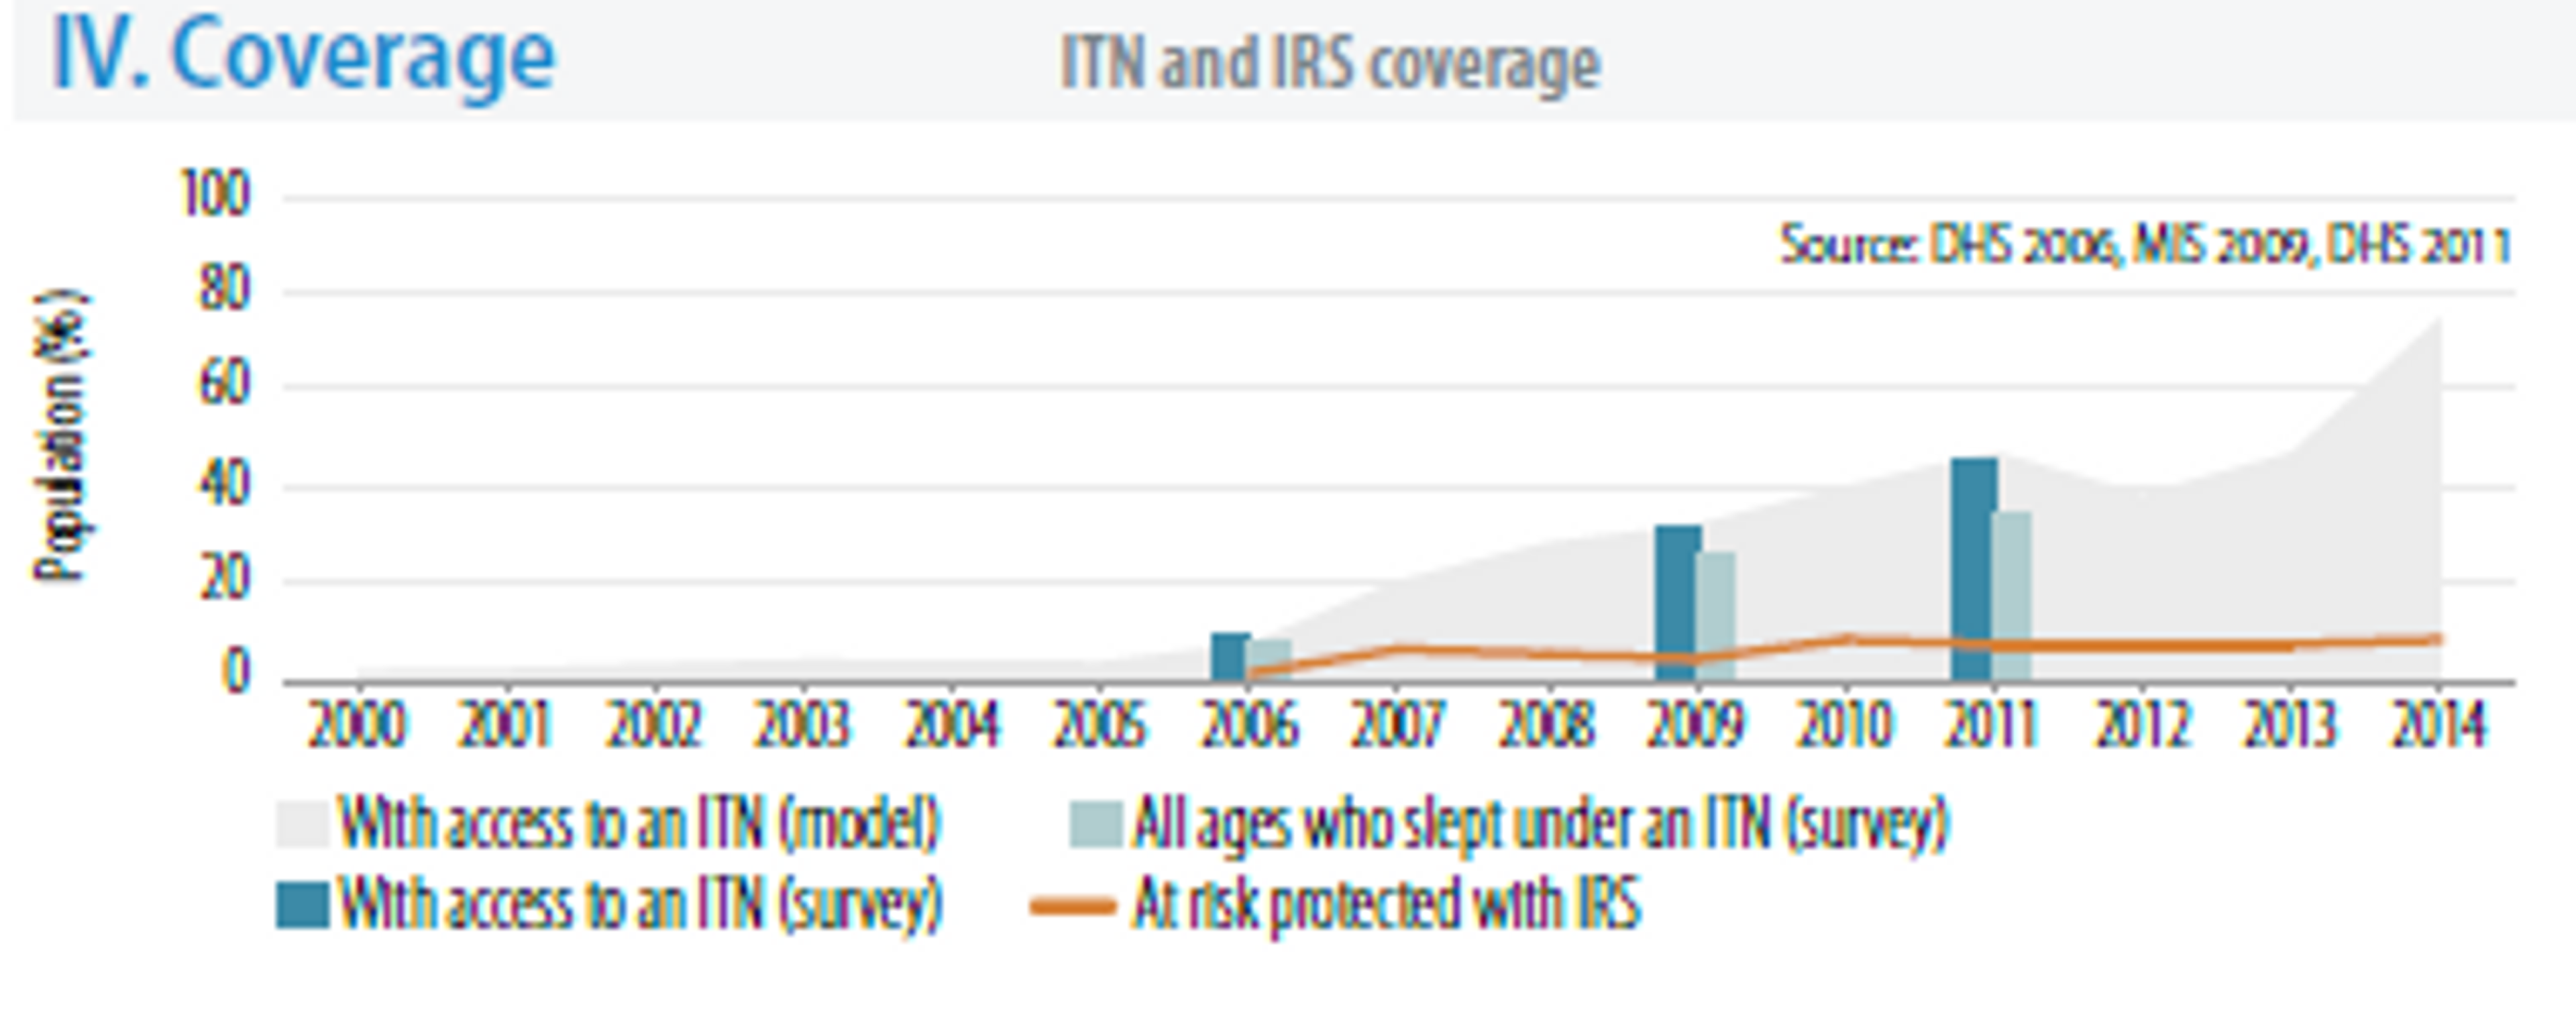
The WHO estimates of the bed nets coverage suggests that in 2014 about 50% of the population had access and slept under ITNs.
The DRC has one of the highest prevalences of lymphatic filariasis55, which can also be prevented by bednet distributions.
Ghana
Ghana is also one of the 15 countries that together account for 80% of malaria cases, and 15 countries that accounted for 78% of malaria deaths56. In 2014, there were 3,415,912 reported cases of malaria and 2506 deaths caused by the disease57.
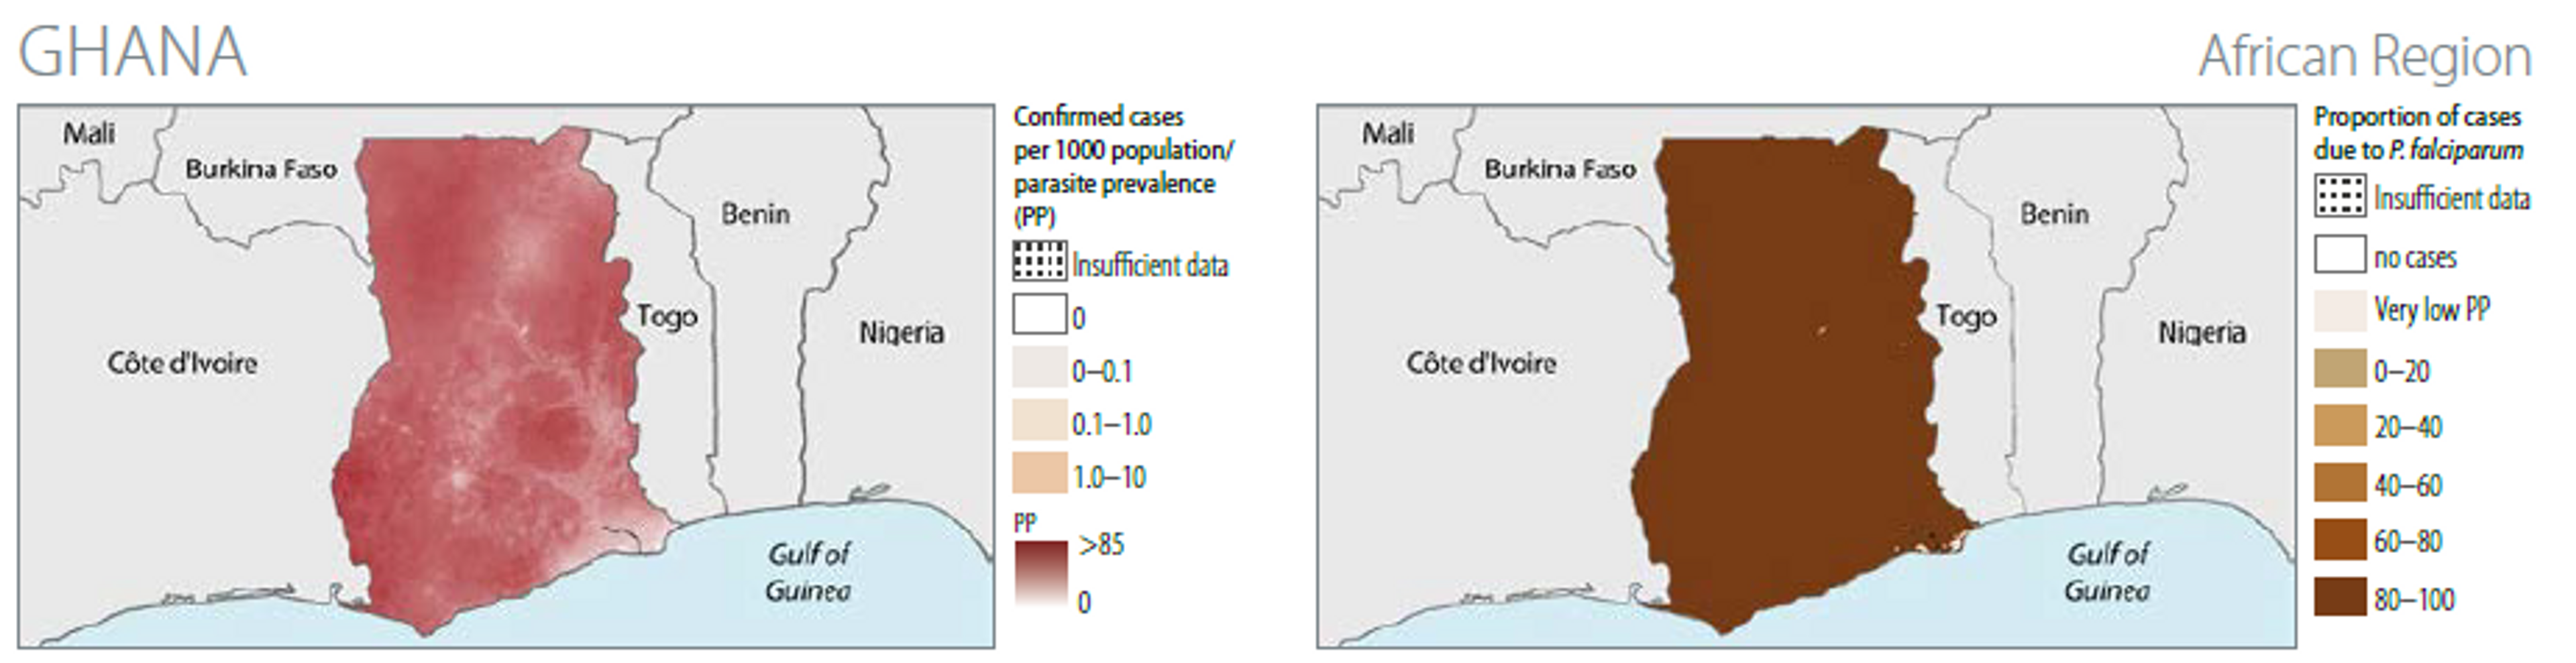
The rate of the disease transmission is high (>1 case per 1000 population) for 100% of the population58.
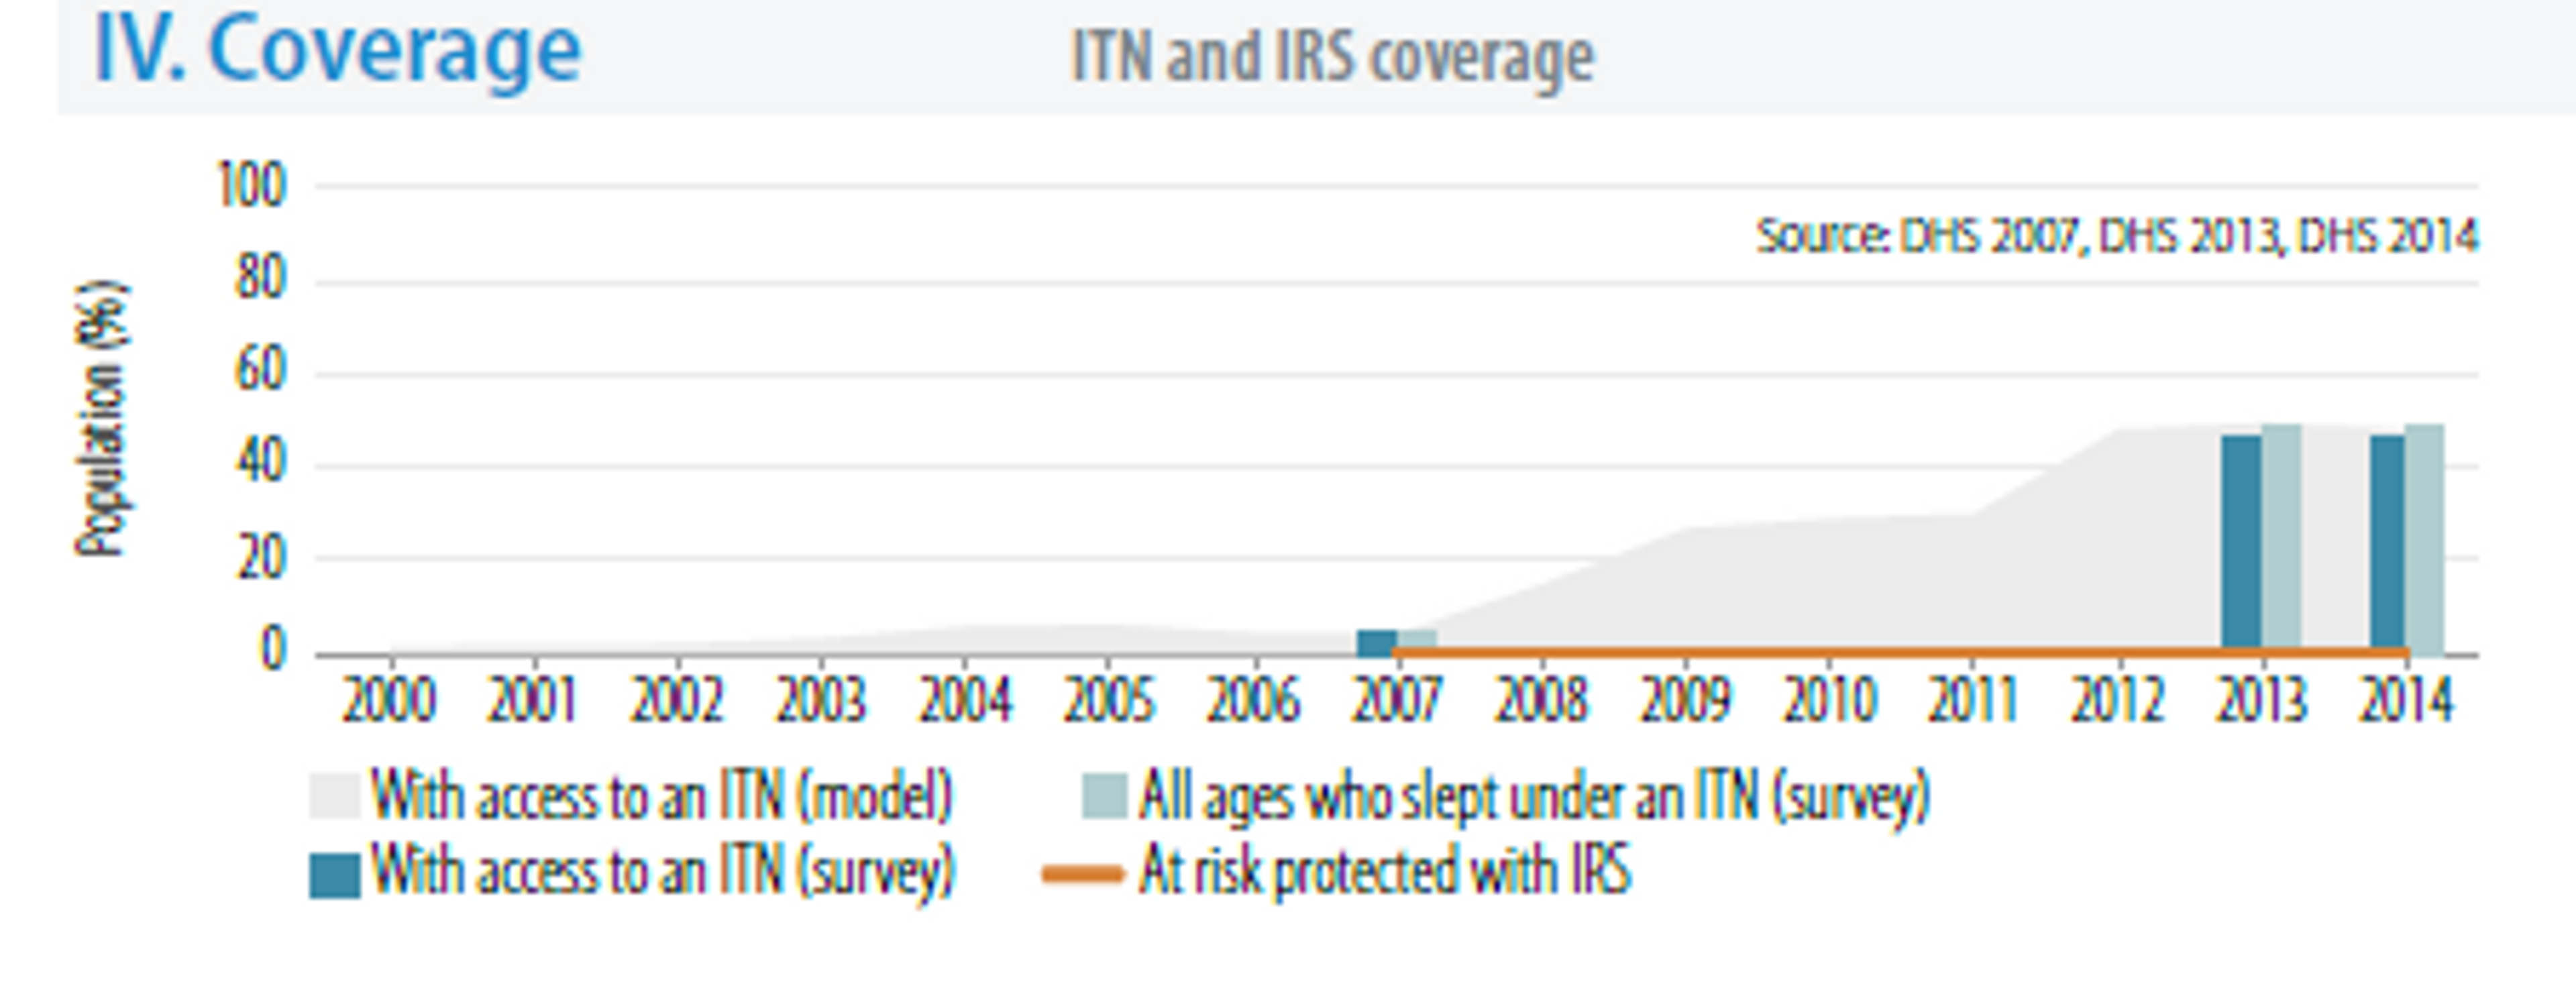
The WHO estimates that in 2014 between 60% and 80% of the population has access to bed net (the first estimate is based on surveys, the second on modelling) and that less than 40% of the population slept under nets (according to survey data)59.
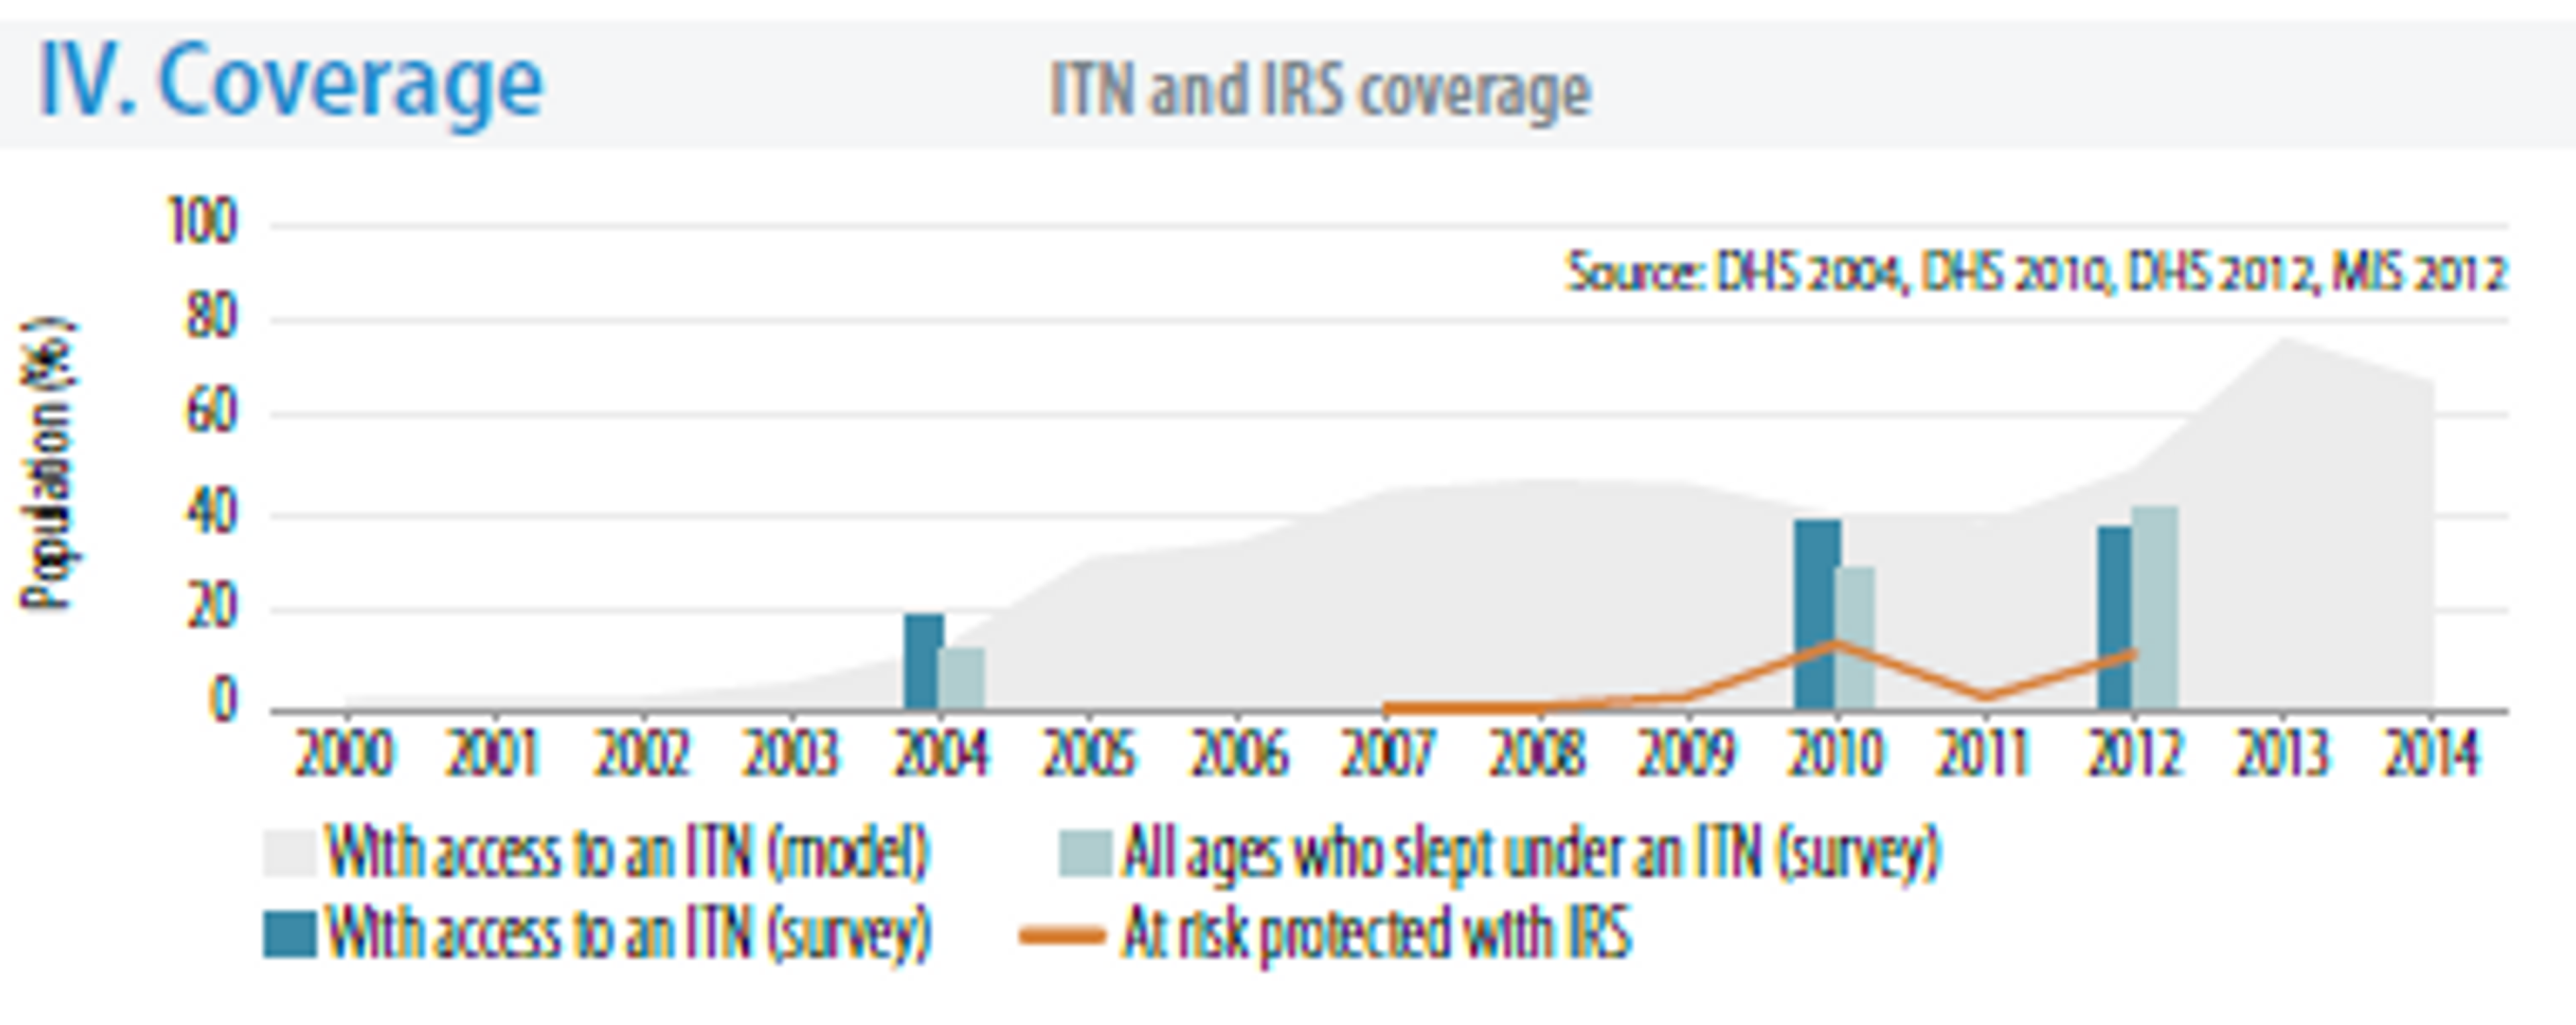
Malawi
In 2014 there were 2,905,310 cases of malaria and 4490 deaths caused by the disease.
The rate of the disease transmission is high (>1 case per 1000 population) for 100% of the population60.
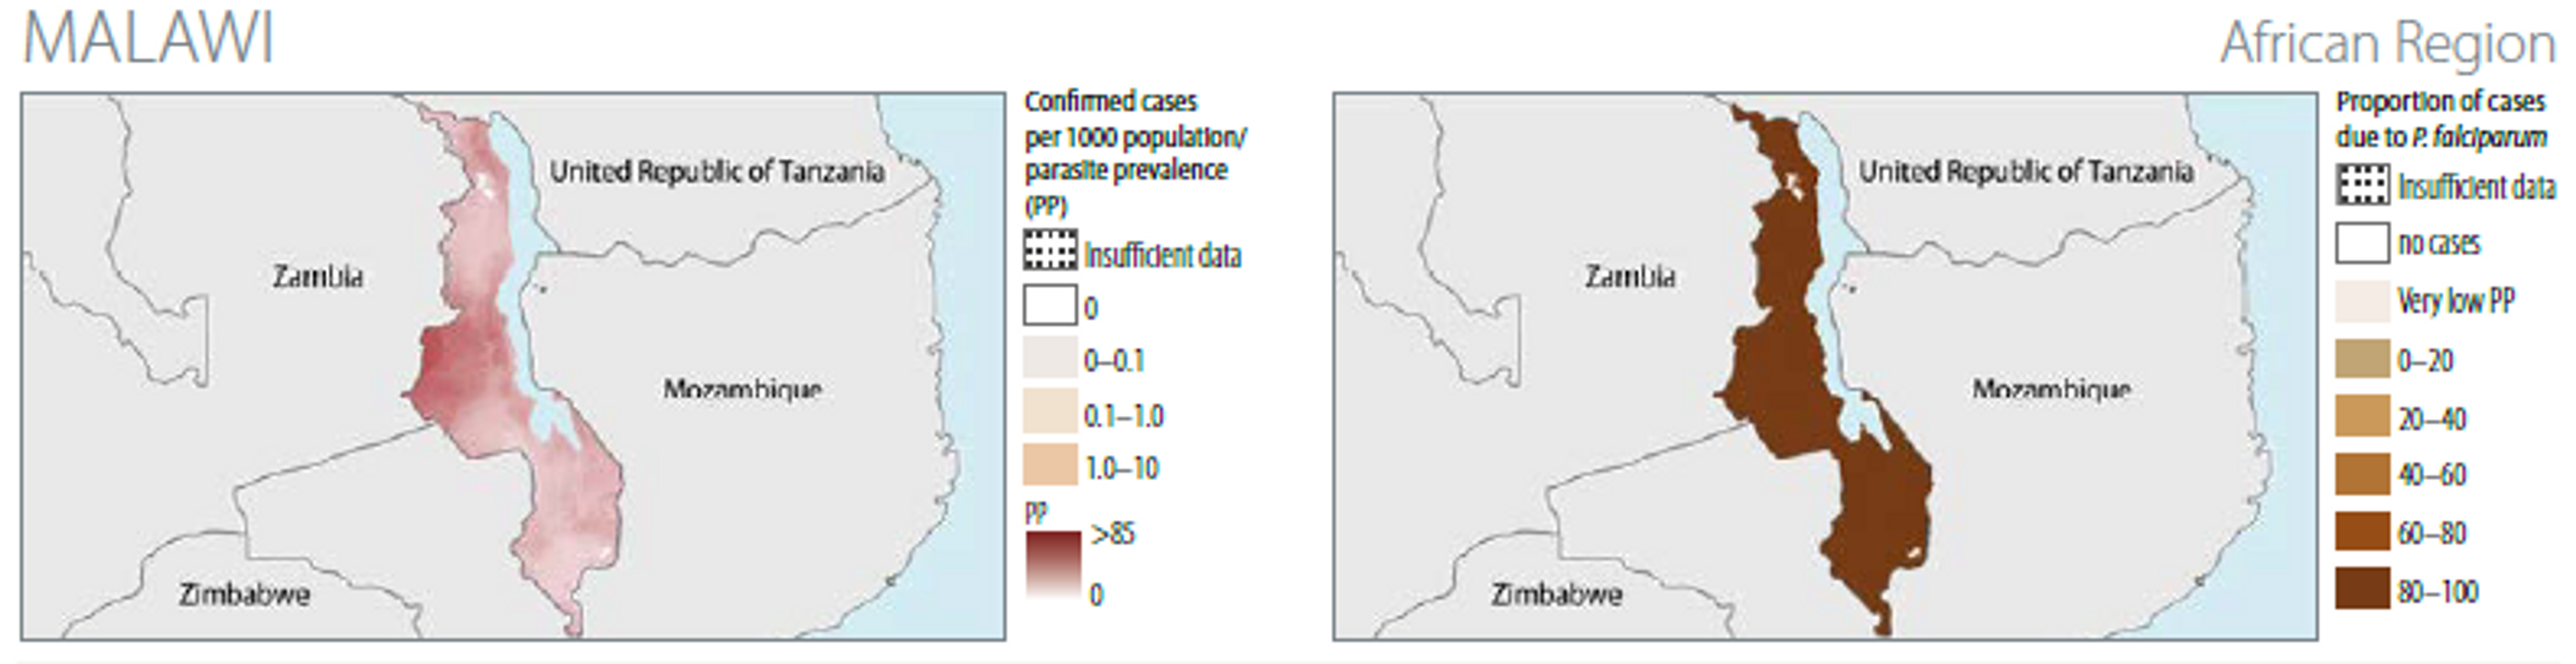
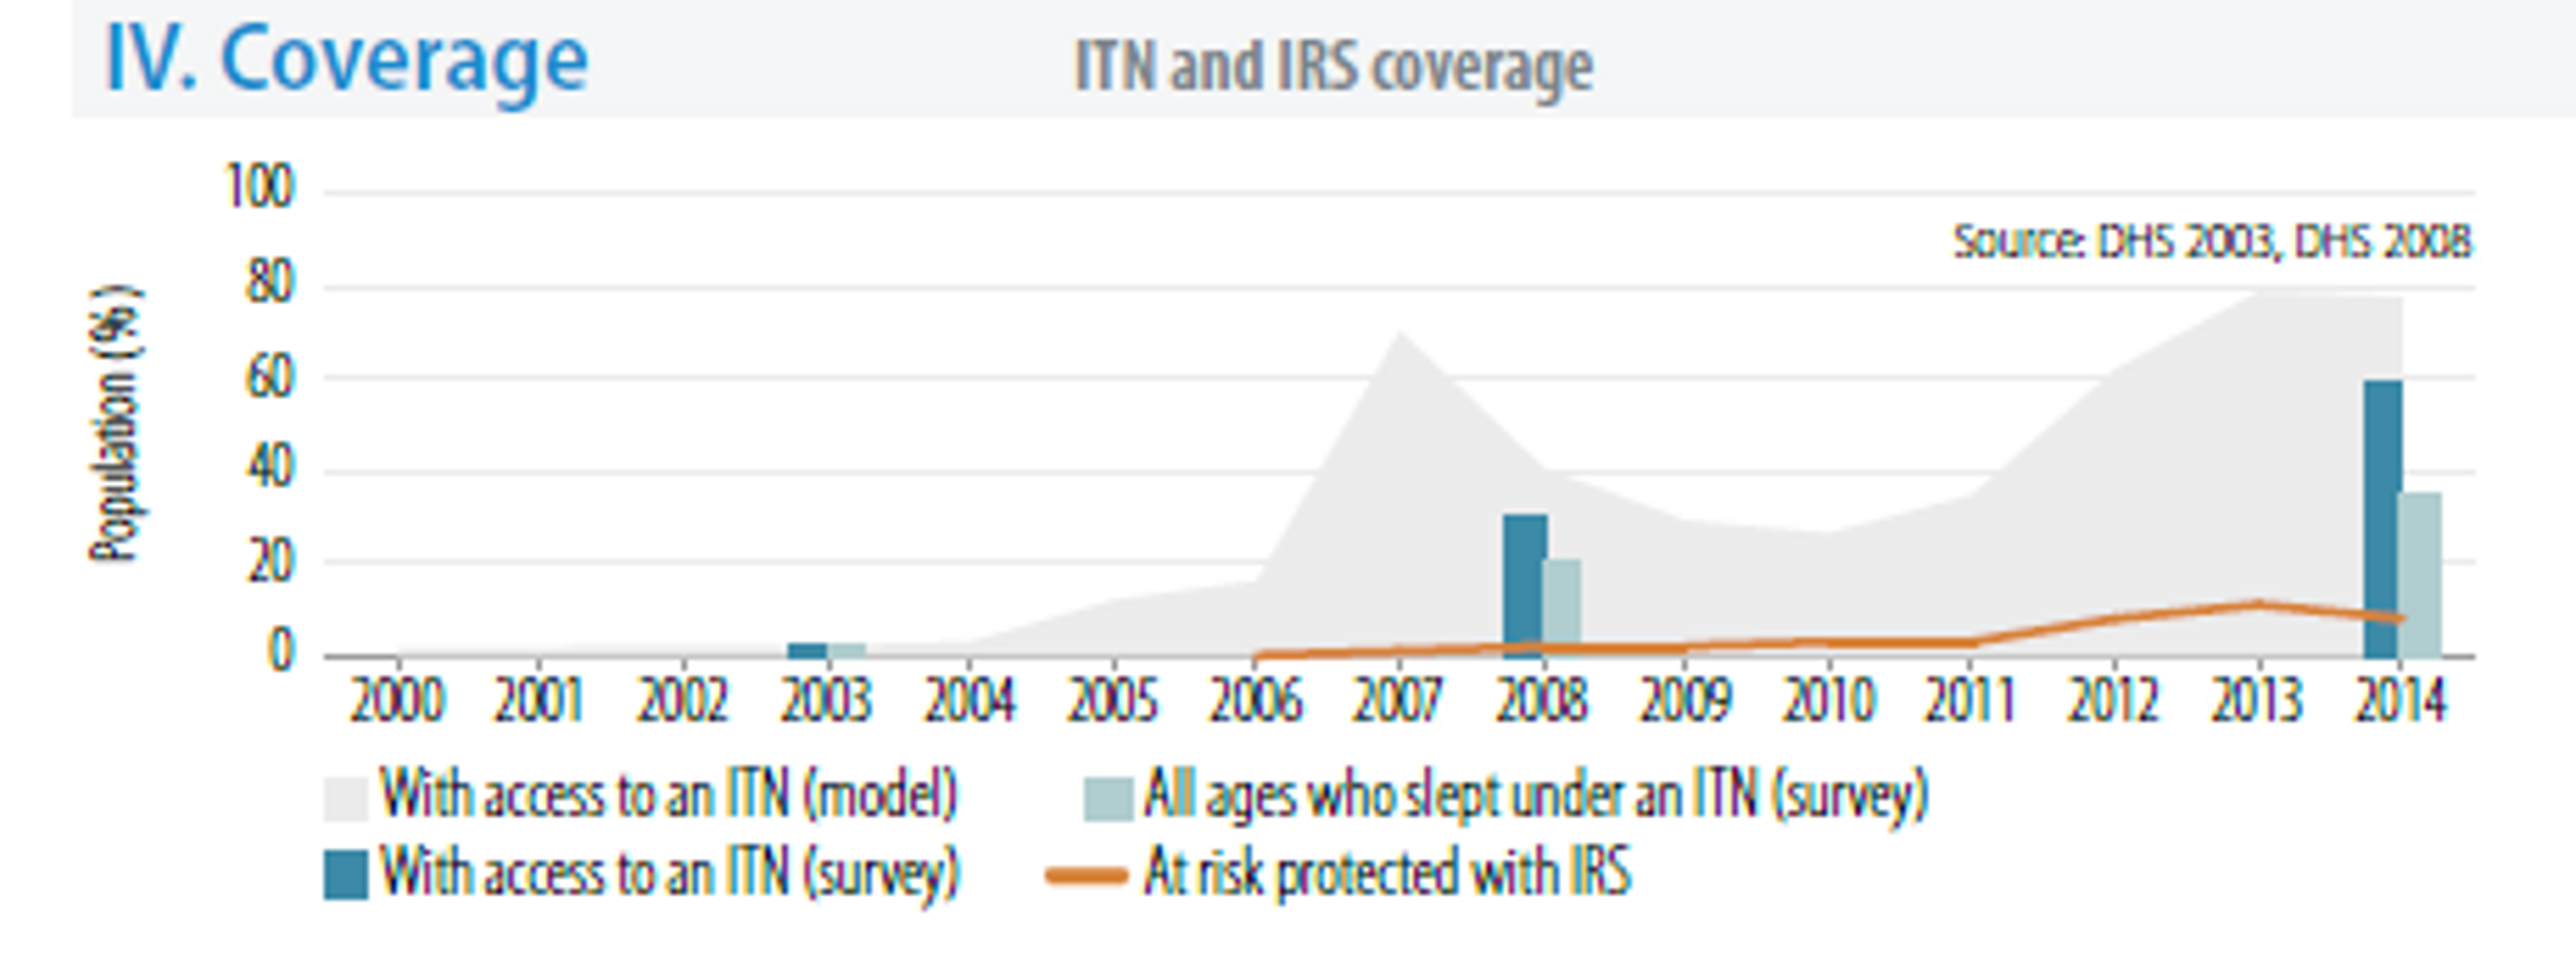
The WHO estimates that in 2012 40% of the population has access to bed nets (from data based on survey on modelling) and that around 30% of the population slept under nets (survey data)61. Modelling suggests that around 60% of the population hadaccess to ITNs in 2014.
Uganda
Malaria is the leading cause of morbidity in Uganda with 90–95 % of the population at risk and it contributing to approximately 13 % of under-five mortality62. Uganda is also one of the 15 countries worst hit by malaria, both in terms of number of cases and deaths.
The rate of the disease transmission is high (>1 case per 1000 population) for 100% of the population63.
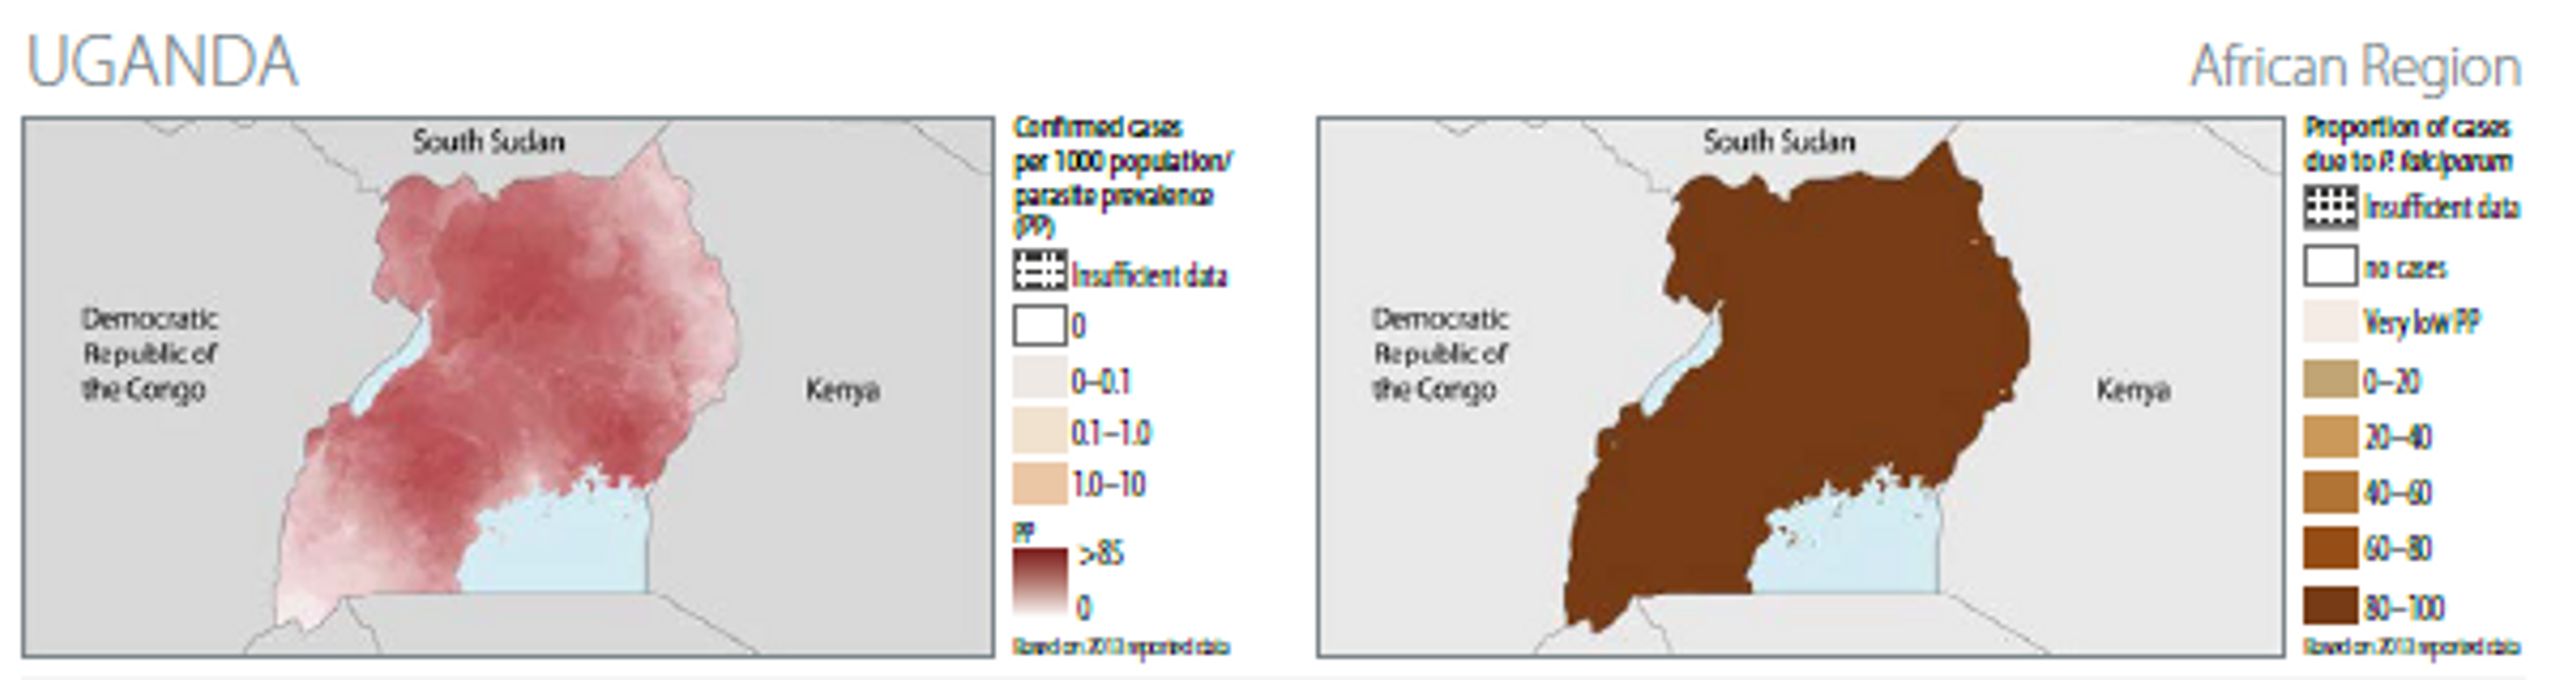
The WHO estimates that in 2011 more than 40% of the population had access to bed nets (from survey and modelling data) and that more than 30% of the population slept under nets (survey data)64. Modelling suggests that around 70% of the population had access to ITNs in 2014.
[^fn-1]: WHO, World Malaria Report 2015, http://www.who.int/malaria/publications/world-malaria-report-2015/report/en/