Measuring What Matters: Two key indicators for the Successor Development Goals
The Millenium Development Goals are an attempt to set overall priorities and targets for fighting poverty. However, they only cover the years up until 2015, so the international community is working to replace them with a set of 'Successor Development Goals' to cover the years from 2015 to 2030. This replacement process was kicked off with the report of the High Level Panel which came out in June with 12 suggested new goals comprised of a total of 54 indicators.
I want to describe two new indicators which I think will help improve the quality of the response to the goals on Health and Poverty. In contrast to the very specific indicators in the report, my proposals are overall measures of health and prosperity which are unlikely to be gamed or to cause distortions because they so closely track what we actually value. The usual drawback of indicators that closely track what really matters is that they are too difficult to measure. As I shall show, this doesn't apply in these cases: we can target what really matters and find out how well we are doing.
Measurement of health
The High Level Panel suggested 'Ensure Healthy Lives' as its 4th goal, and it seems very likely that something of this kind will appear in the final list of goals. The Panel suggested five indicators, all of which are quite focused. These include vaccine coverage rates, under-5 death rates, and maternal mortality. These indicators track things that are important, but there are many parts of health that they don't cover. I think it is important to consider adding an indicator that directly measures good health so as to leave less room between what we are targeting and what we care about.
A natural and important measure is Life Expectancy, but it has a significant flaw: while it tracks mortality, it doesn't take morbidity into account. The solution is to instead use a measure called Healthy Life Expectancy (or HLE), which is currently used to track population health in the EU. This is the life expectancy in a population with each year alive weighted by the quality of health experienced. It is thus a measure of both the quantity and quality of health in an average person's life. It is based on the standard population health units of Quality Adjusted Life Years and Disability Adjusted Life Years (QALYs and DALYs), and corresponds to the average number of QALYs in someone's life. Measuring Healthy Life Expectancy requires a considerable amount of data, but luckily this is already collected and collated for the regular Global Burden of Disease report and this could easily be adapted to measure this indicator at a national level. This would have the added advantage of using the DALY framework for measuring the levels of morbidity, which is the standard in global health.
Adding a Healthy Life Expectancy target will:
- make it easier to know how we are succeeding overall at improving health
- naturally incorporate new health promotion opportunities as they arise
- allow for differences in what is most effective in different countries
- count improvements in health from causes outside the health sector
- encourage finding new ways improve health as cost effectively as possible
- be impossible to 'game' as it tracks what we really care about
Measurement of poverty
The High Level Panel's 1st goal is to 'End Poverty'. It suggests we measure this with a set of indicators related to income and material living standards (the non-financial aspects of poverty are covered in other goals). As with health, it seems very likely that a goal like this will be present in whatever final form the Successor Goals take. One of the key indicators used by the Panel is the number of people below the World Bank's $1.25 a day poverty line. This line measures the market value of all the goods a person consumes (even if they were made personally rather than bought) and adjusts for purchasing power parity (PPP). The other indicators suggested are improved access to property rights, access to social protection systems, and reducing deaths due to natural disasters.
Other groups have called for a measure of financial inequality such as the Gini coefficient to be added to this list, but the Panel resisted this, focusing on absolute poverty. One reason for this resistance to an inequality goal is that equality can be improved in ways that make everyone worse off, such as by lowering everyone's income but lowering the richest people's by the largest amount.
There is, however, a simple way to have an indicator that measures financial prosperity, takes financial inequality into account, and is immune to the above problem. Consider GDP per capita, which is a simple measure of the average amount of consumption per person, and thus of material prosperity. This measure takes no account of how consumption is distributed in the society, and thus no account of inequality. If we simply measure the GDP per capita, we effectively assume that the benefit to an individual of increasing consumption from $1,000 to $2,000 per annum is only a hundredth that of increasing from $100,000 to $200,000. However, we know that individuals have diminishing marginal returns on consumption: the more you are already spending, the less benefit you get from spending an additional dollar. Economists have measured this relationship and found it to be logarithmic (or even more quickly diminishing). If it were logarithmic, it would say that the benefit one gets from doubling one's consumption is the same no matter what the starting point. Thus the two changes in consumption mentioned earlier would count as equally beneficial.
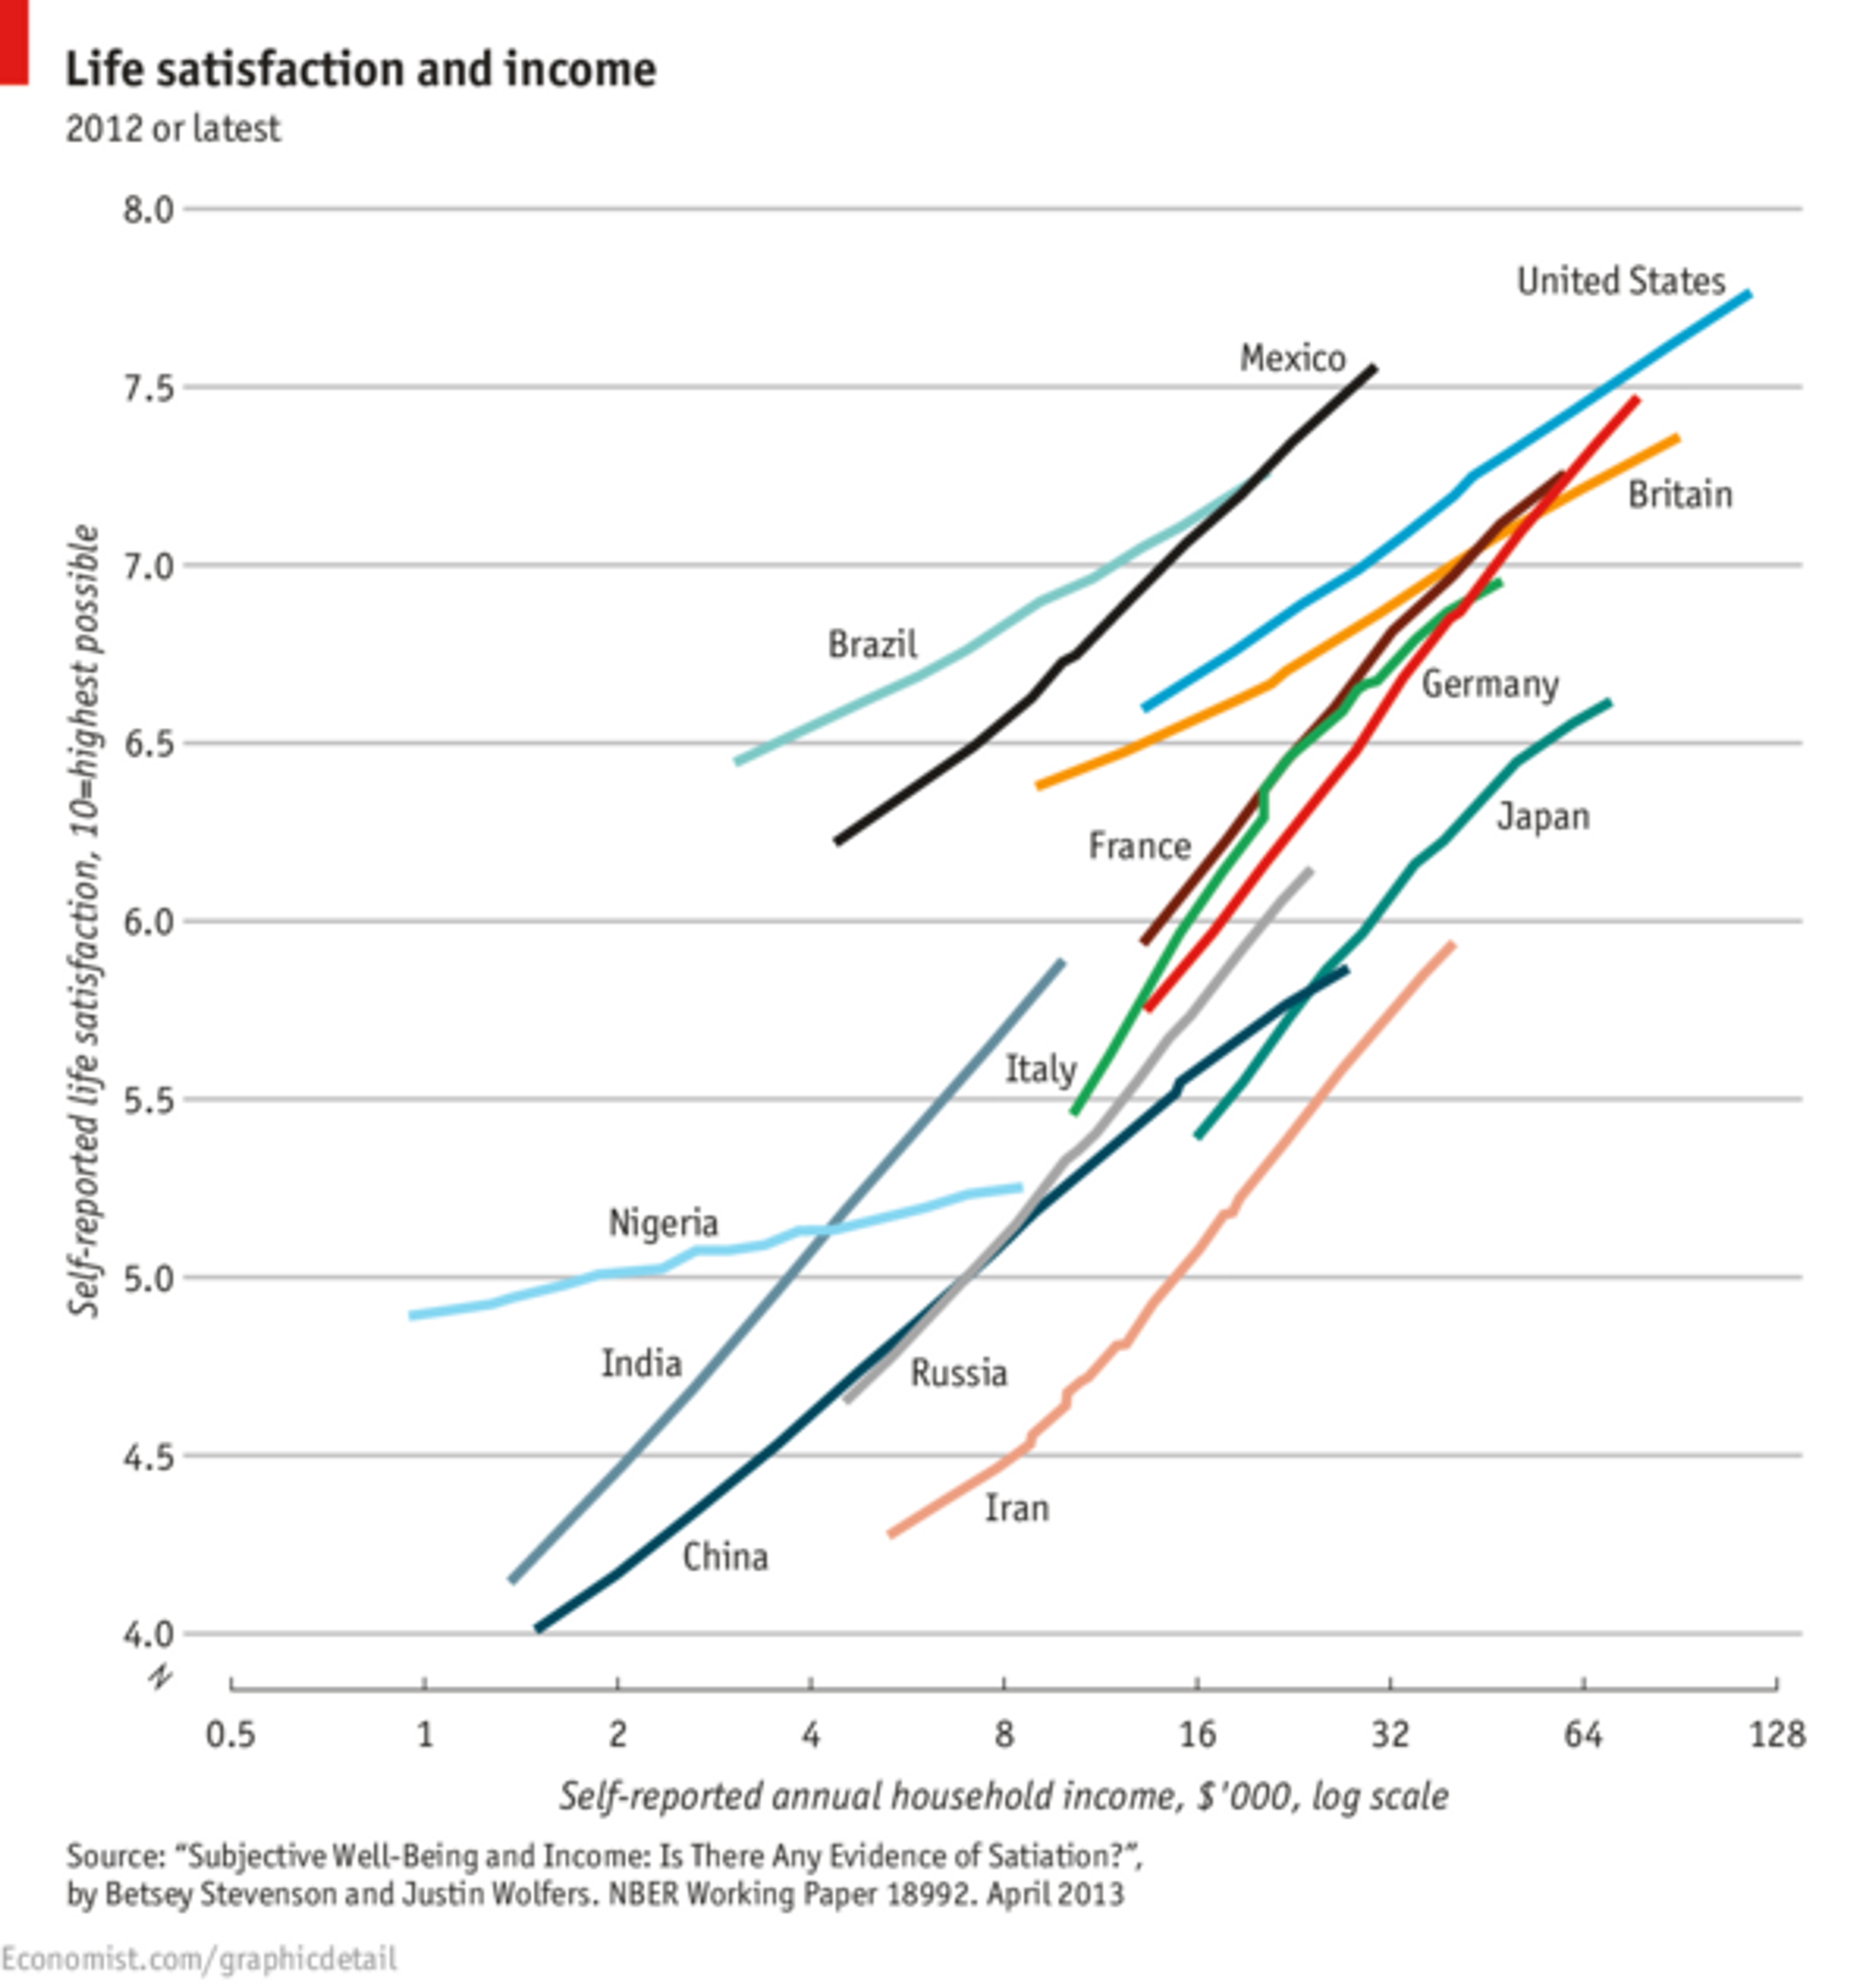
This chart shows that between countries and within countries there is a strong relationship between the logarithm of people's income and their life satisfaction.
We can take this into account by taking the logarithm of each person's consumption (adjusted for PPP) before averaging them. We could call this the 'average log-consumption', and it would be a measure of the prosperity in a country. Suppose one person consumes $1,000 per year and another consumes $100,000 per year. The logarithms are:
- log($1,000) = 3.00
- log($100,000) = 5.00
- average = 4.00
If we added $1,000 to the poorer person's consumption, it would take the average up to 4.15. Whereas if we added $1,000 to the richer person's consumption, it would only take the average up to 4.002. In practice, the figures for the average log-consumption in different countries would all be within the range of 2.50 to 4.50. Increasing it by 0.01 corresponds to a rise of about 2% in consumption across the board, or a smaller rise targeted at the poorest.
Using a measure like this for (economic) poverty will:
- take distribution into account
- never reward lowering some incomes without increasing others
- be based on scientific results about diminishing returns on consumption
- be a decent proxy for a gross domestic happiness index
- get the best of both worlds of GDP per capita and an inequality measure
- avoid distortions caused by having an arbitrary poverty line
- be mathematically elegant
- be possible without gathering much new data
This indicator will thus be a useful way of measuring a development goal on financial poverty, and would also be a very useful general indicator of a country's prosperity for other purposes (such as measuring progress, classifying countries, and being targeted by government policy).
Both Healthy Life Expectancy and Average Log-Income measure what really matters, and do so with relatively modest additional data gathering. If we are serious about these development goals, we should incorporate these measures.