Project Healthy Children
Giving What We Can no longer conducts our own research into charities and cause areas. Instead, we’re relying on the work of organisations including J-PAL, GiveWell, and the Open Philanthropy Project, which are in a better position to provide more comprehensive research coverage.
These research reports represent our thinking as of late 2016, and much of the information will be relevant for making decisions about how to donate as effectively as possible. However we are not updating them and the information may therefore be out of date.
Cause Area: Micronutrient Deficiencies
Project Healthy Children (PHC) is a charity that we began investigating in recent years, and it has been one of our promising charities for nearly 2 years.
We have reviewed Project Healthy Children in the past and also written an introduction on micronutrient fortification. Our colleagues at Givewell have not officially reviewed PHC, but provide a great overview in form of a conversation note with PHC’s Chief operating officer, Laura Rowe. Givewell has also published extensive intervention reviews on Micronutrient fortification as implemented by Project Healthy Children (Salt iodization, Vitamin A fortification, Zinc fortification). Finally, they have also written reports on organisations similar to PHC, such as GAIN and IGN. These programmes are generally considered to be very effective and some of the effectiveness analyses are generalizable to PHC.
In this paper, we give you an update about their efforts that we feel complement Givewell’s intervention reports and our previous report. You can find more general information about PHC on their website. In our opinion, PHC continues to be a very promising charity with potentially a very high cost-effectiveness.
Updates from countries in which PHC is currently active
The following updates are quotes from the World Bank’s 2013 ‘Nutrition at a Glance’ country reports of those countries in which PHC is active.
Rwanda1
Annually, Rwanda loses nearly US$50 million in GDP to vitamin and mineral deficiencies.
Scaling up core micronutrient interventions would cost US$6 million per year.
52% of children under the age of five are stunted, 16% are underweight, and 5% are wasted. 6% of infants are born with a low birth weight. Rwanda’s progress over the past two decades has not improved to meet MDG 1c (halving 1990 rates of child underweight by 2015) with business as usual.
Rwanda performs worse than countries in its region and income group. Countries with lower per capita incomes, such as Togo and DRC exhibit reduced rates of child stunting.
Rwanda has Higher Rates of Stunting than Lower-Income Peers GNI per capita (US$2008).
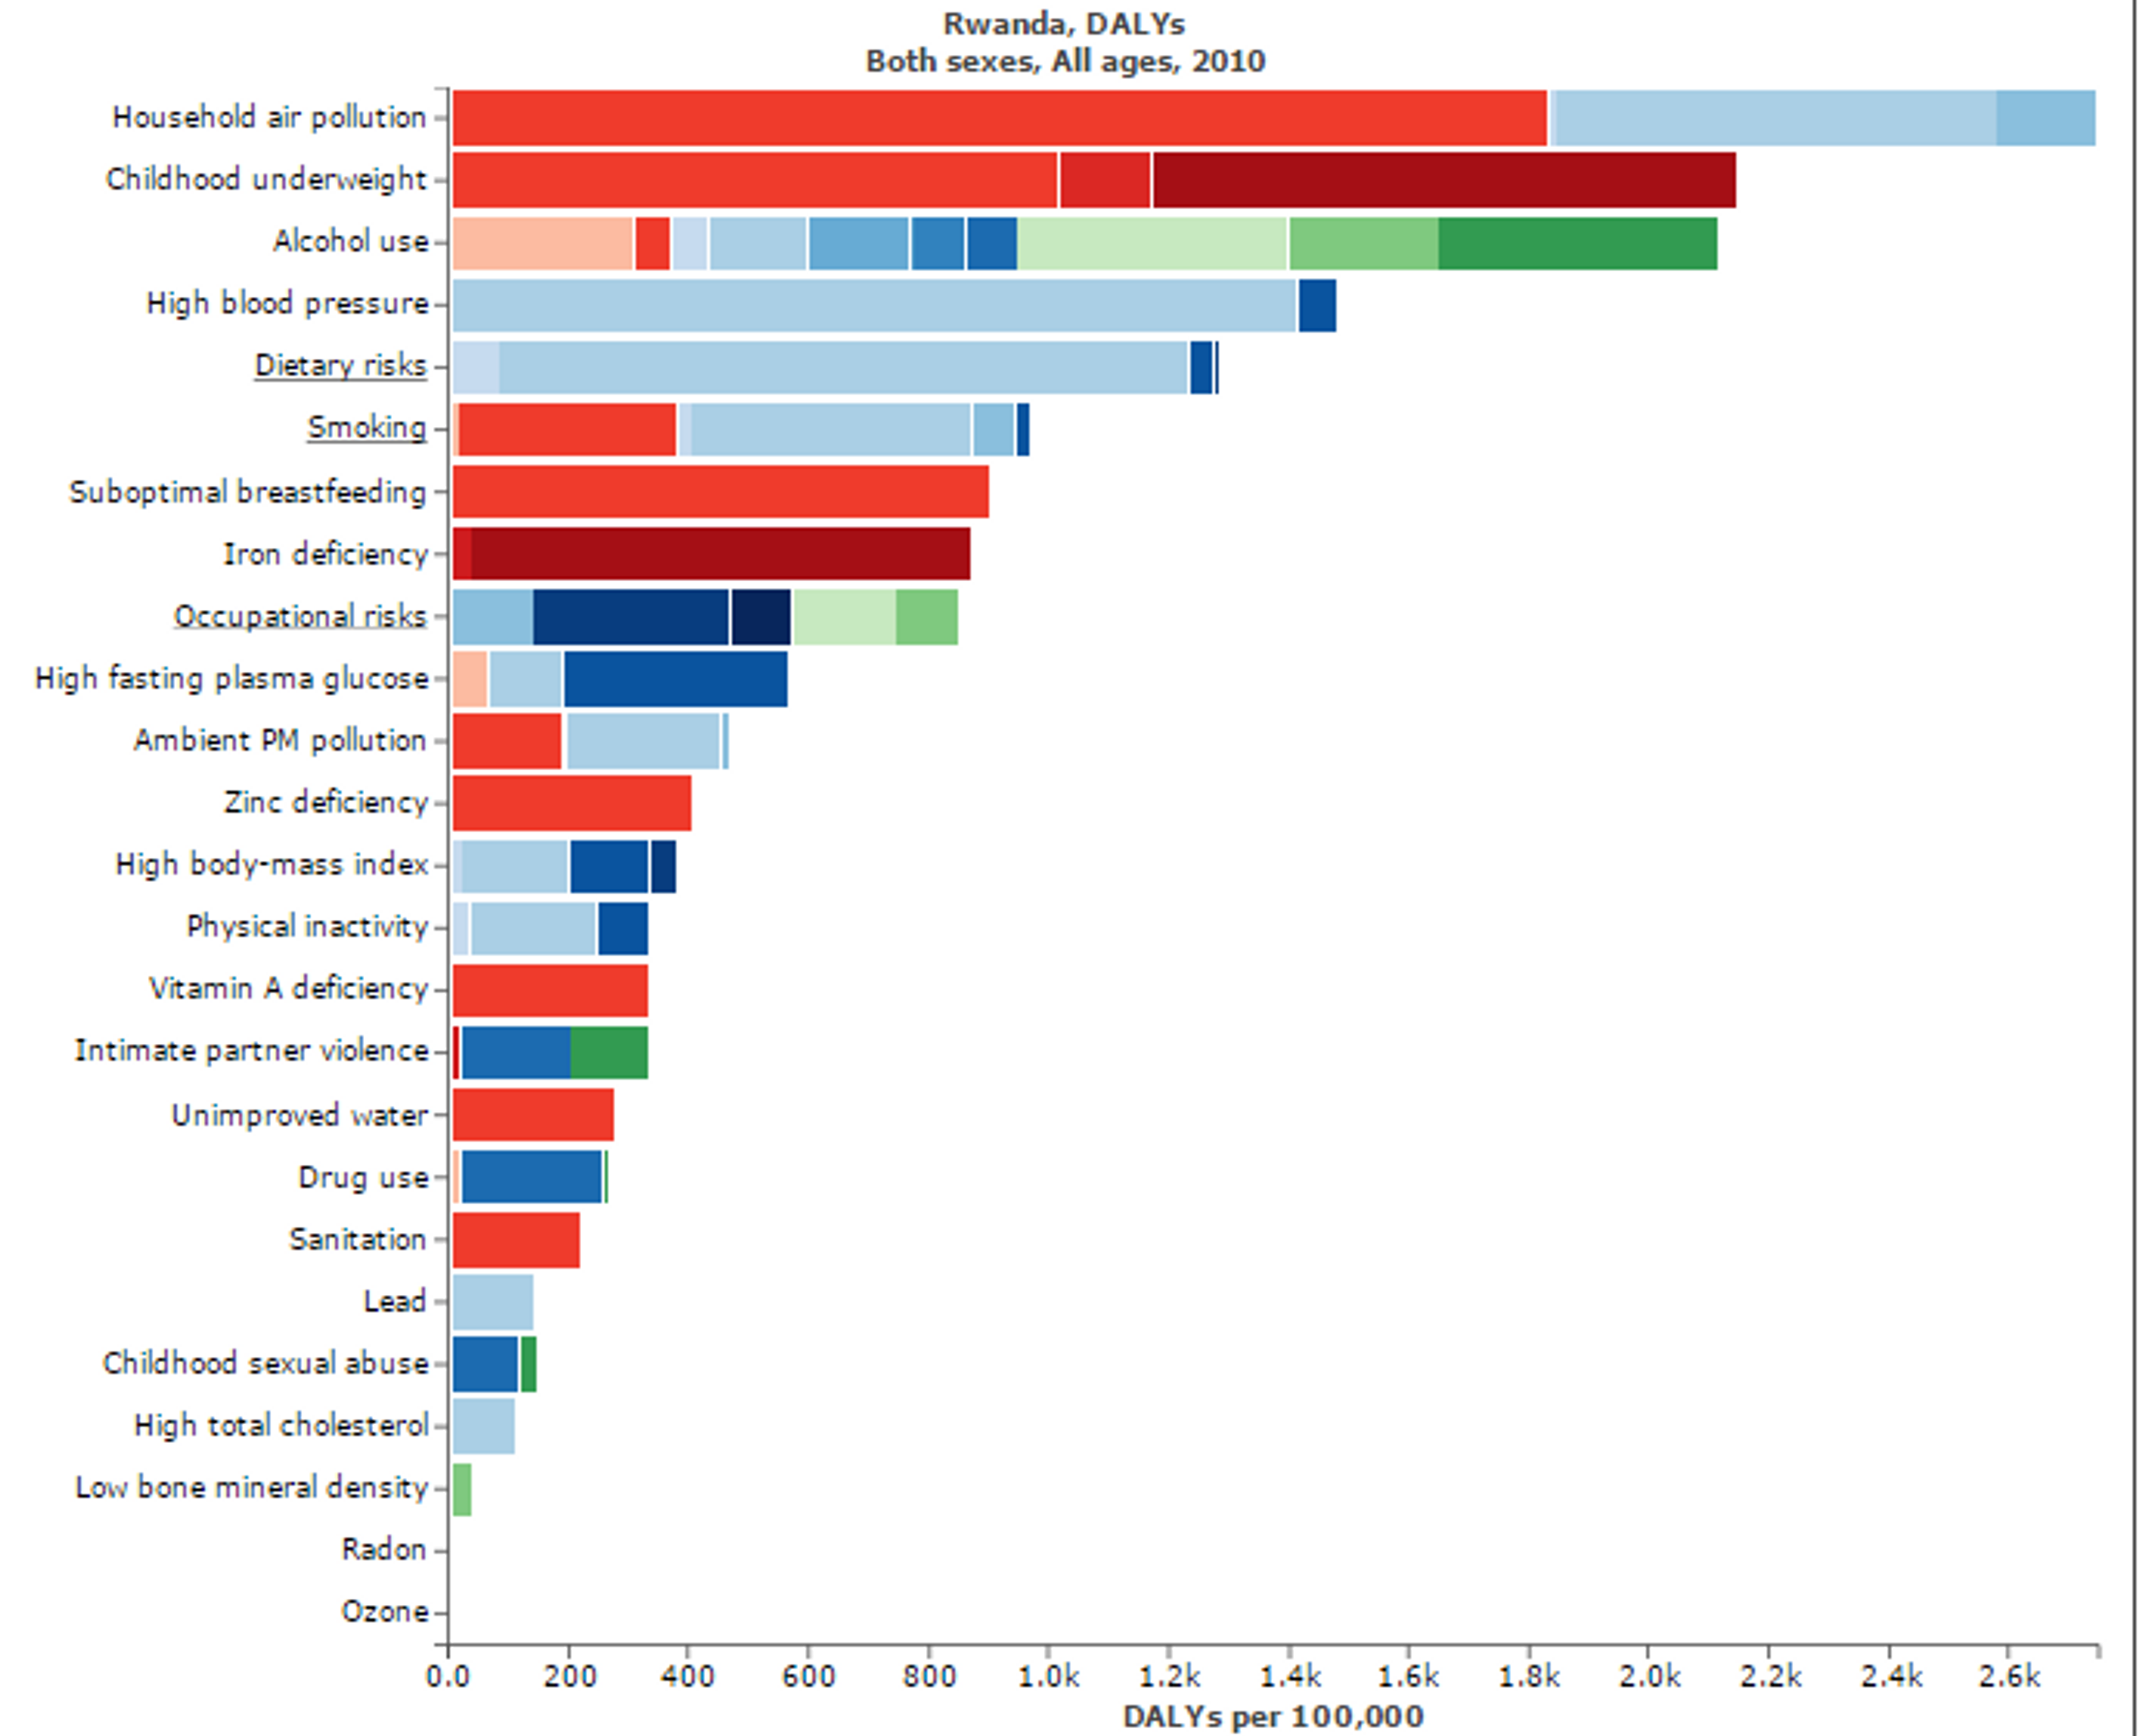
Figure 3: Figure shows risk factors for “Disability adjusted life years” in Rwanda. Micronutritional deficiencies, such as Iron, Zinc, and Vitamin A deficiencies, are substantial risk factors. Figure adapted with ‘Global Burden of Disease Compare tool’- see http://ihmeuw.org/3hck. © 2013 University of Washington - Institute for Health Metrics and Evaluation (Global burden of Disease data 2010, released 3/2013)
Malawi2
Annually, Malawi loses over US$600 million in GDP to vitamin and mineral deficiencies. Scaling up core micronutrient interventions would cost less than US$9 million per year.
Malawi has the 5th-highest stunting rate in the world. 53% of children under the age of five are stunted, 15% are underweight, and 4% are wasted. 13% of infants are born with a low birth weight. Malawi’s progress over the past two decades has not improved to meet MDG 1c (halving 1990 rates of child underweight by 2015) with business as usual.
Malawi’s stunting rates are higher than many of its income peers in Africa. While per capita income is very low in Malawi, other countries show that it is possible to reduce stunting with the same or lower GNI.
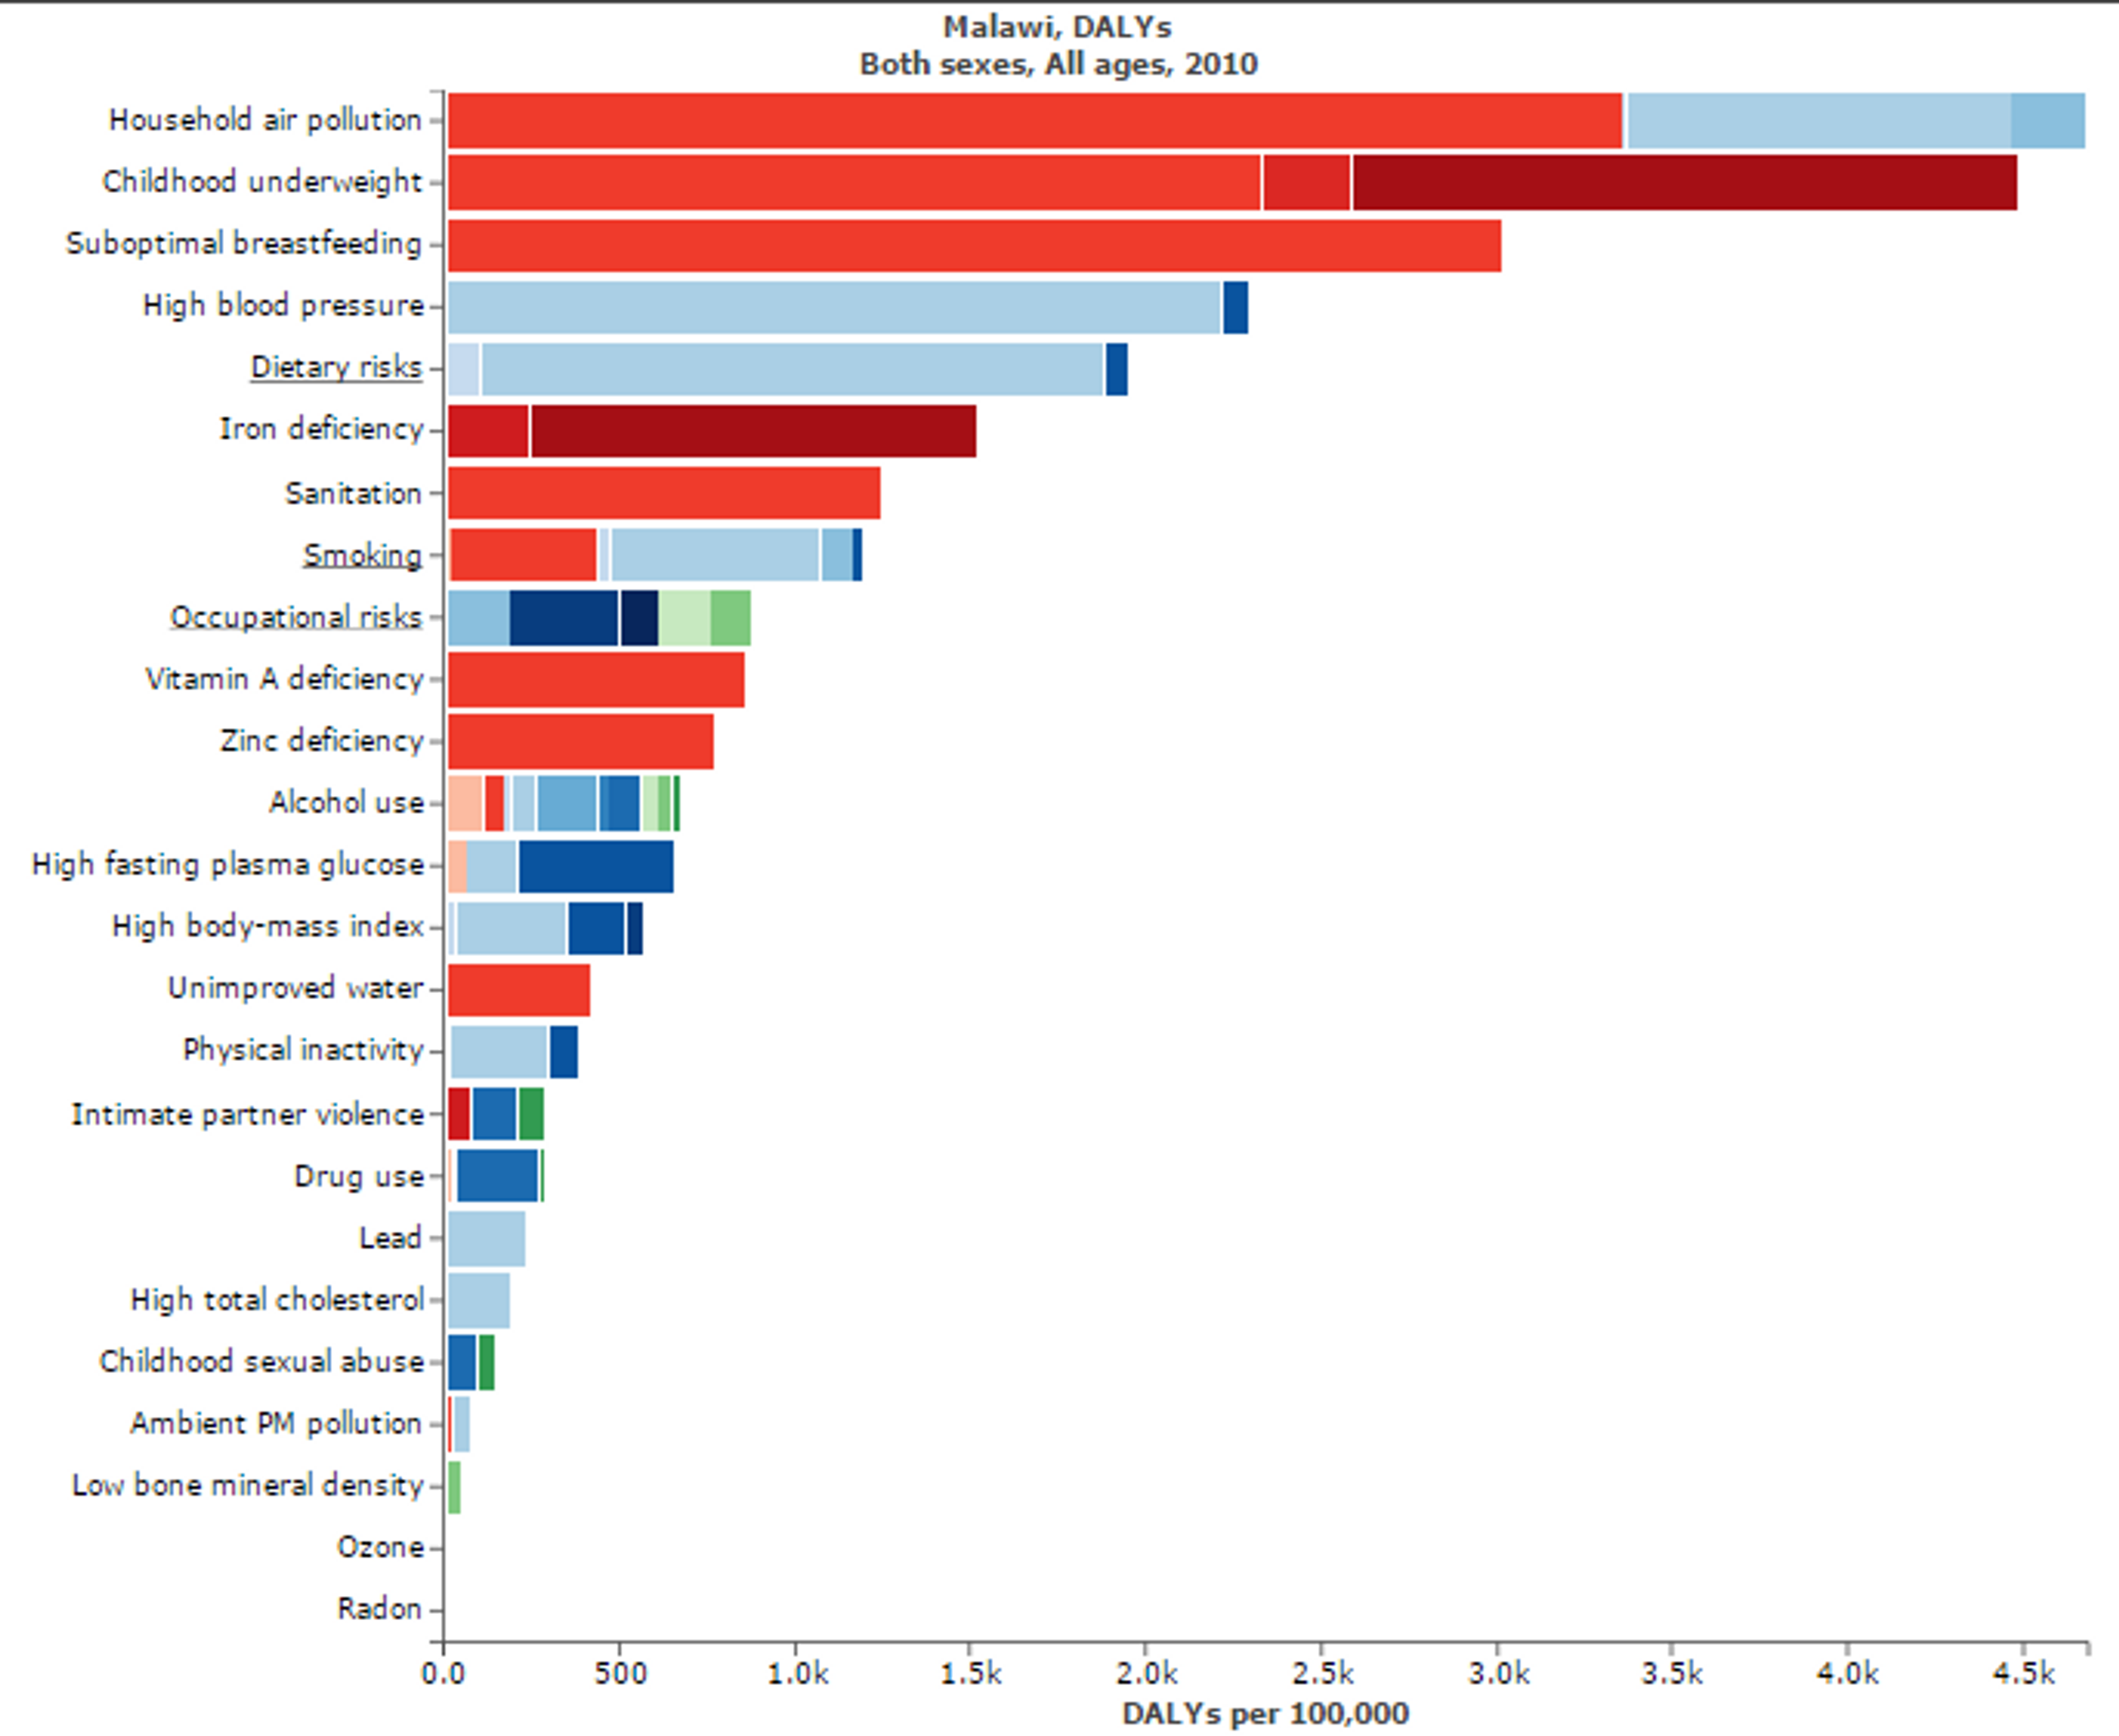
Figure 4: Figure shows risk factors for “Disability adjusted life years” in Malawi. Micronutritional deficiencies, such as Iron, Zinc, and Vitamin A deficiencies, are substantial risk factors. Figure adapted with ‘Global Burden of Disease Compare tool’- see http://ihmeuw.org/3hck. © 2013 University of Washington - Institute for Health Metrics and Evaluation (Global burden of Disease data 2010, released 3/2013)
Liberia3
Annually, Liberia loses over US$11 million in GDP to vitamin and mineral deficiencies. Scaling up core micronutrient nutrition interventions would cost US$2 million per year
39% of children under the age of five are stunted, 19% of children under the age of five are underweight, and 8% are wasted.
Liberia will not meet MDG 1c (halving 1990 rates of child underweight by 2015) with business as usual. 14% of infants are born with a low birth weight.
Liberia’s stunting rates are higher than many countries in the Africa region with similar per capita income.
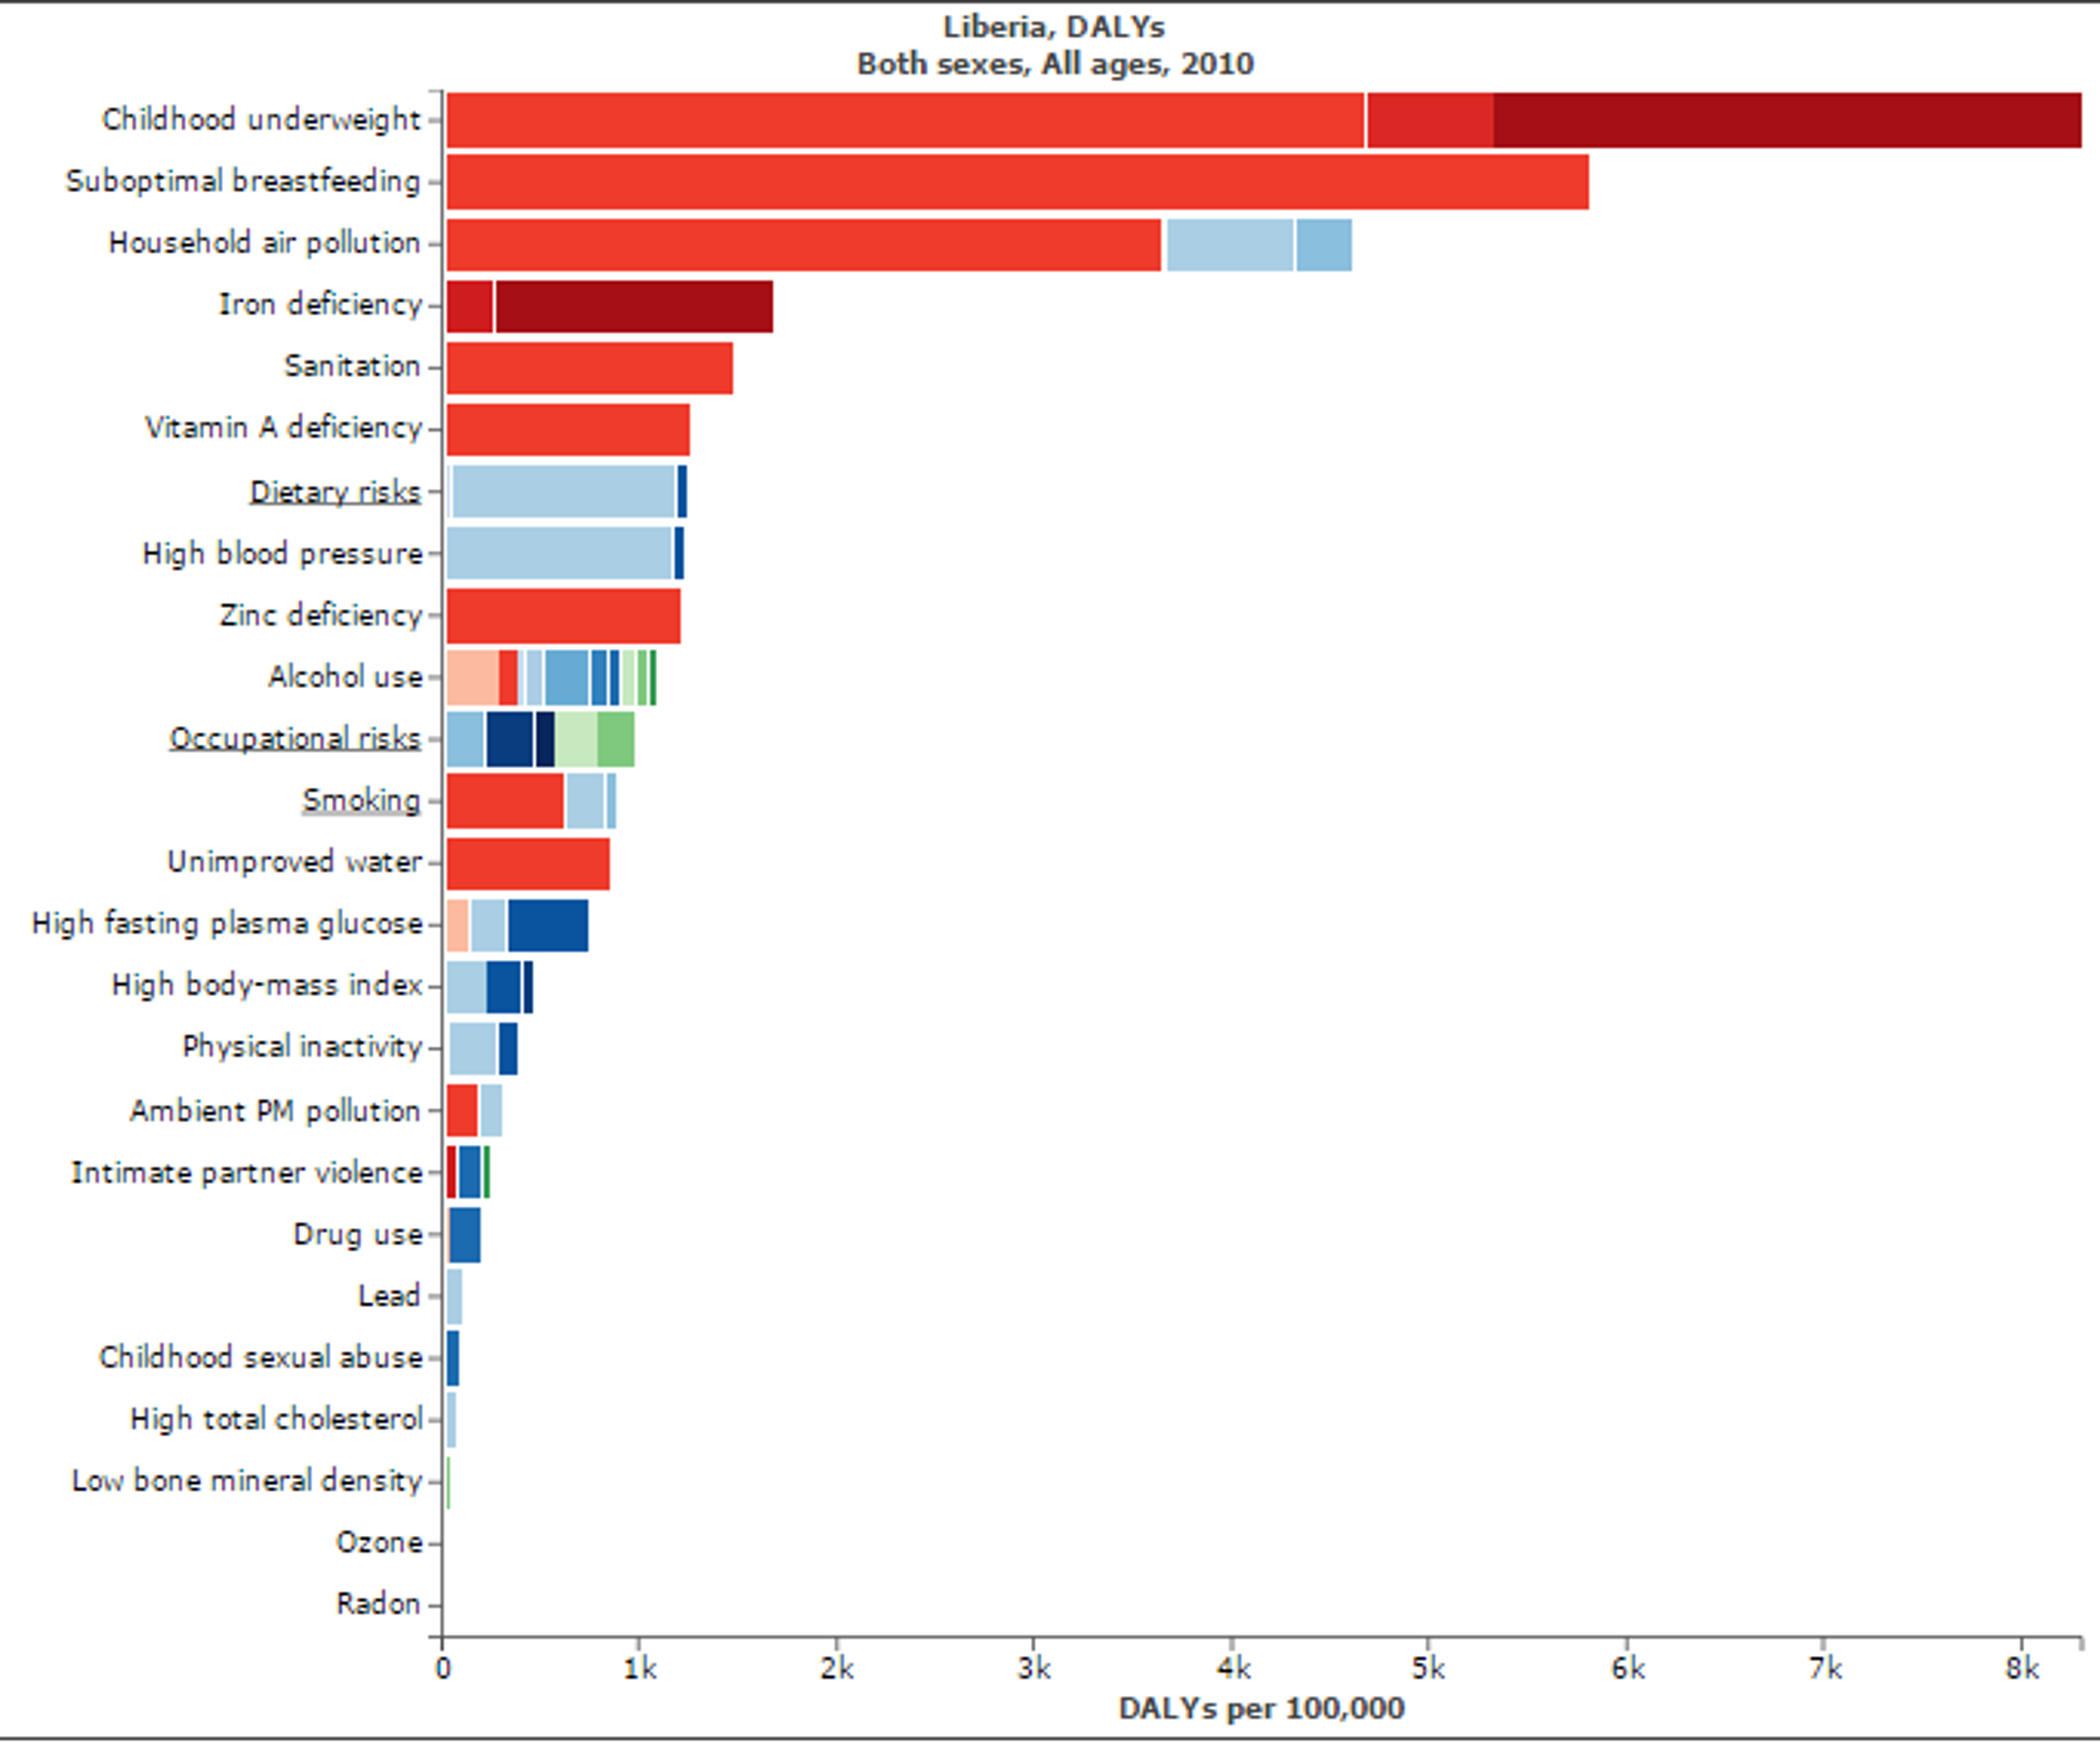
Figure 5: Figure shows risk factors for “Disability adjusted life years” in Liberia. Micronutritional deficiencies, such as Iron, Zinc, and Vitamin A deficiencies, are substantial risk factors. Figure adapted with ‘Global Burden of Disease Compare tool’- see http://ihmeuw.org/3hck. © 2013 University of Washington - Institute for Health Metrics and Evaluation (Global burden of Disease data 2010, released 3/2013)
Burundi4
Annually, Burundi loses US$30 million to vitamin and mineral deficiencies. Scaling up core micronutrient interventions would cost US$4 million per year.
53% of children under the age of five are stunted, 35% are underweight, and 7% are wasted. 11% of infants are born with a low birth weight...the prevalence of stunting is substantially higher in Burundi compared to other countries in the Africa region with similar per capita incomes. It is possible to achieve better nutrition outcomes despite low income.
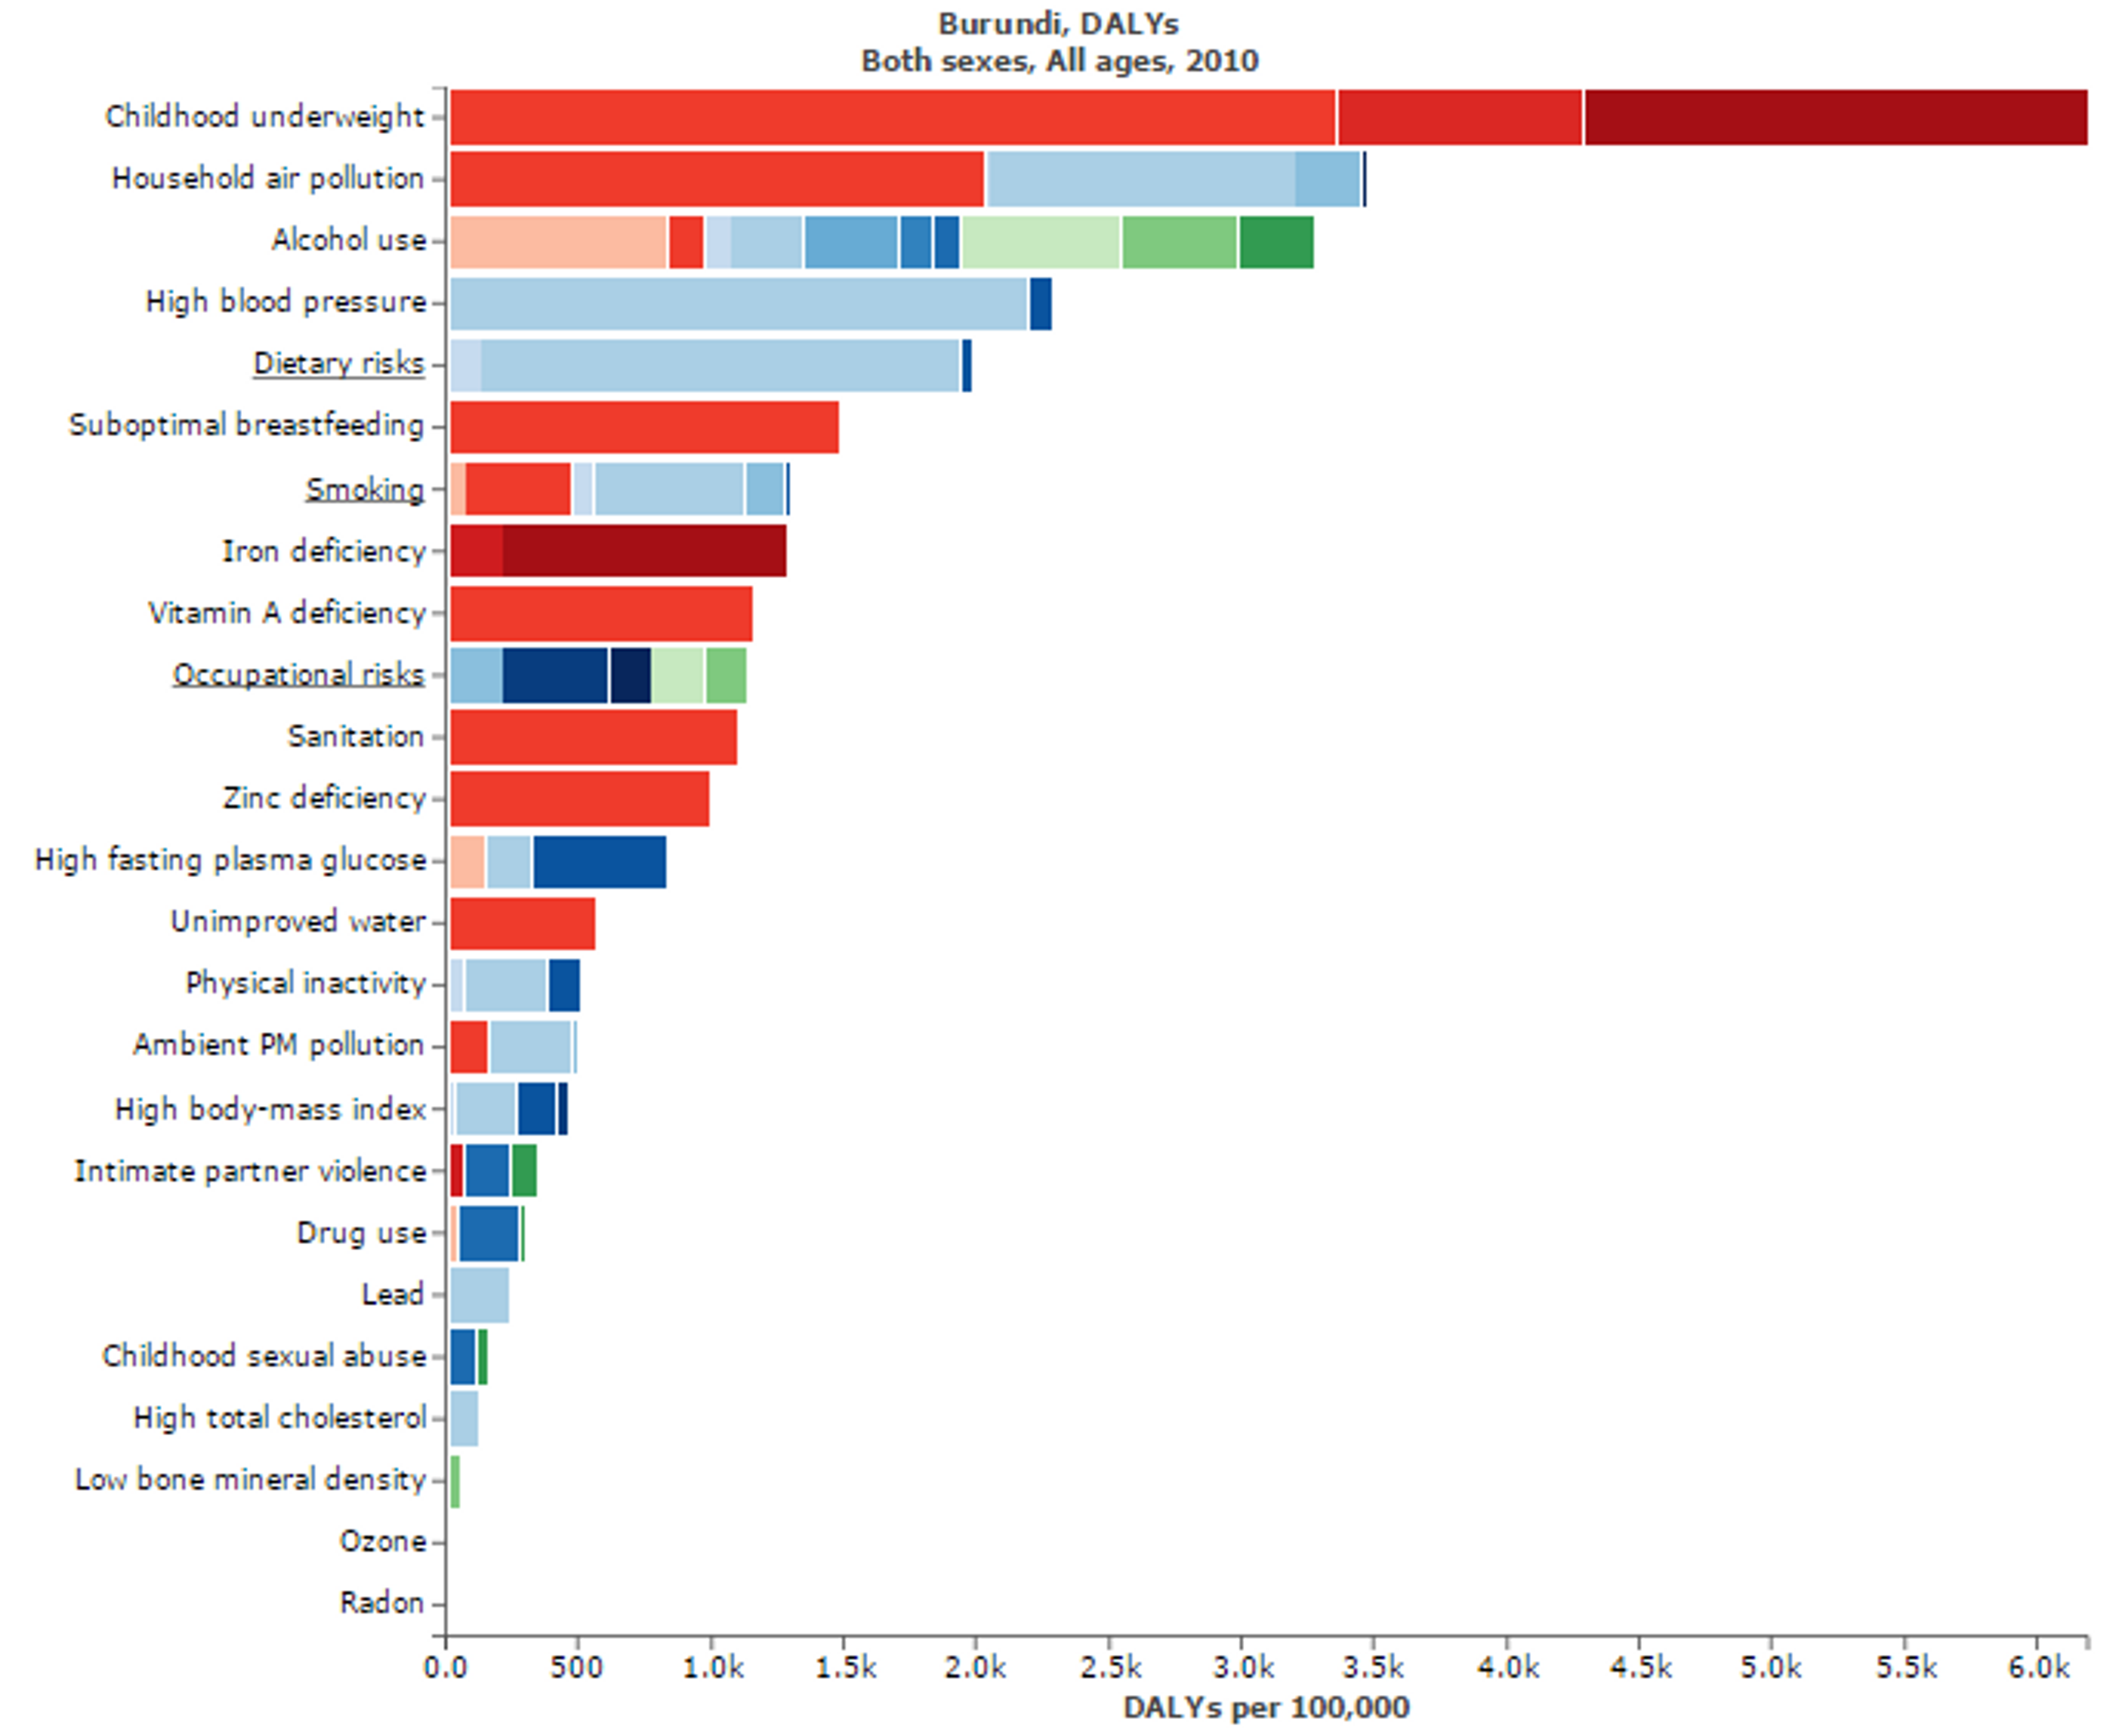
Figure 6: Figure shows risk factors for “Disability adjusted life years” in Burundi. Micronutritional deficiencies, such as Iron, Zinc, and Vitamin A deficiencies, are substantial risk factors. Figure adapted with ‘Global Burden of Disease Compare tool’- see http://ihmeuw.org/3hck. © 2013 University of Washington - Institute for Health Metrics and Evaluation (Global burden of Disease data 2010, released 3/2013)
Zimbabwe5
Annually, Zimbabwe loses nearly US$24 million in GDP to vitamin and mineral deficiencies. Scaling up core micronutrient interventions would cost less than US$8 million per year.
33% of children under the age of five are stunted, 12% are underweight, and 7% are wasted. 11% of infants are born with a low birth weight. Zimbabwe is currently not on track to meet MDG 1c (halving 1990 rates of child underweight by 2015) with business as usual. When overall rates of child stunting are examined, Zimbabwe performs better than countries in its region and income group. However, within the country, there is likely to be variation across geographies and socio-demographic groups.
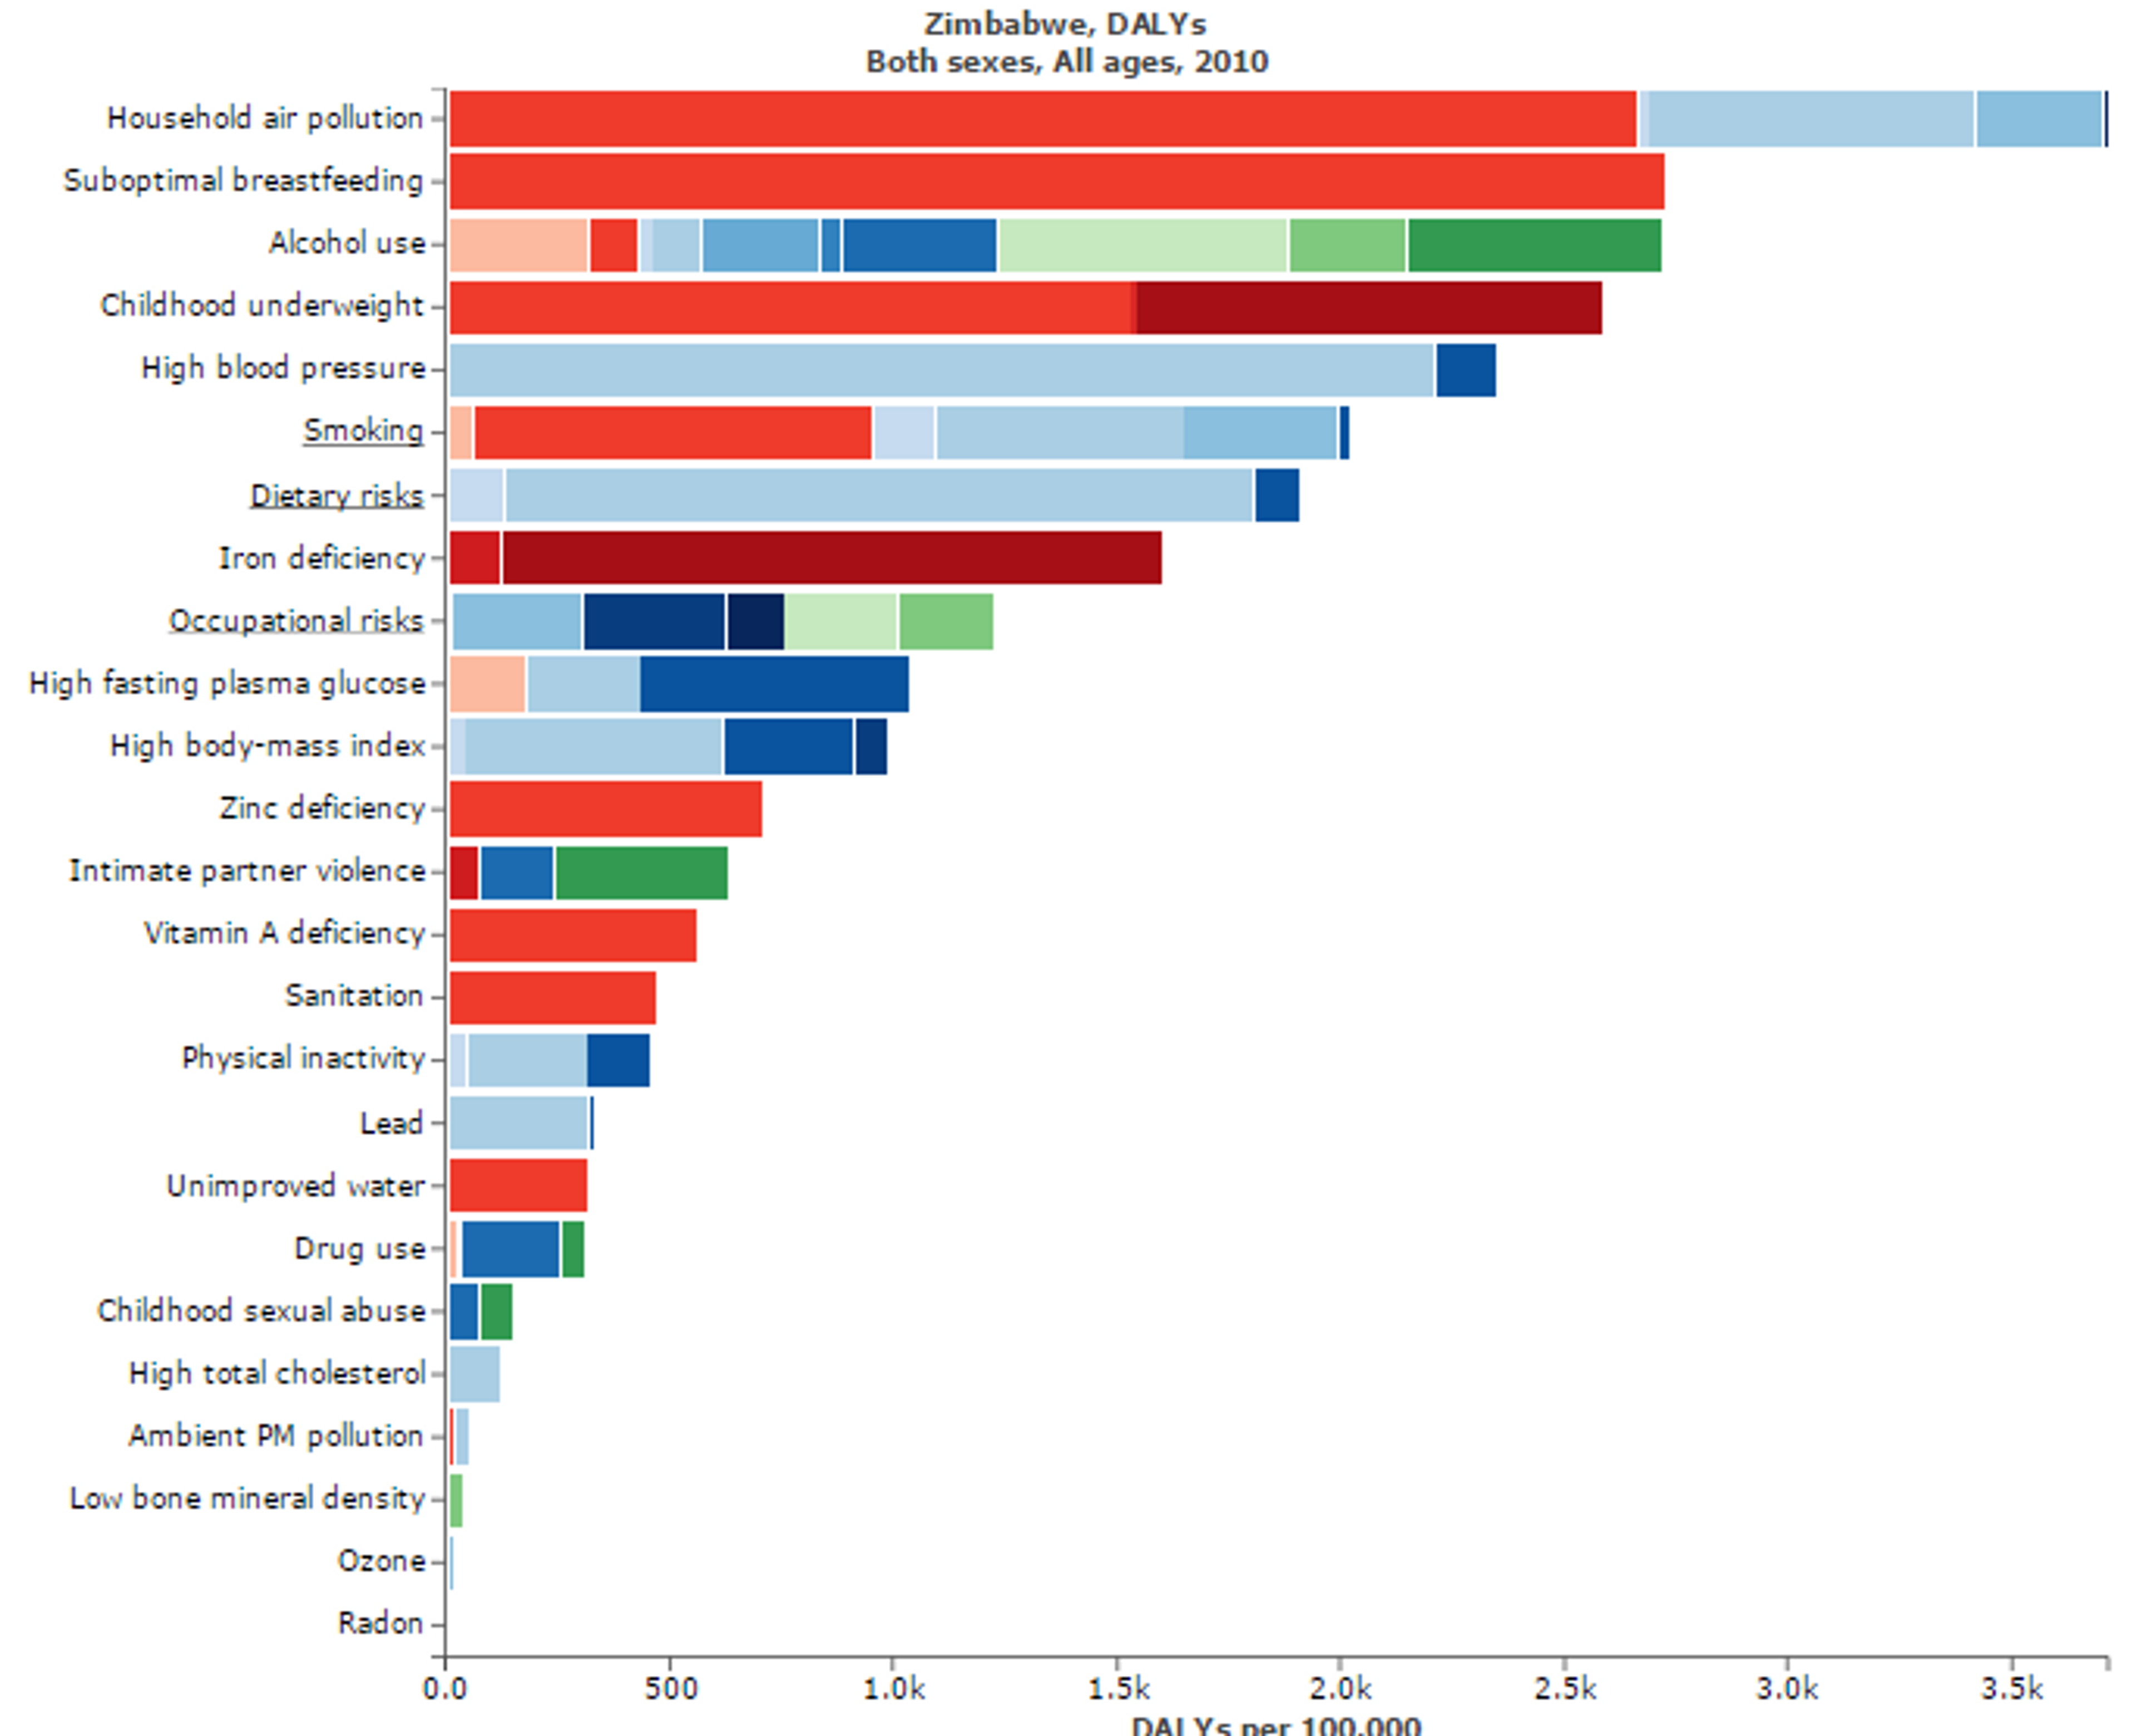
Figure 7: Figure shows risk factors for “Disability adjusted life years” in Zimbabwe. Micronutritional deficiencies, such as Iron, Zinc, and Vitamin A deficiencies, are substantial risk factors. Figure adapted with ‘Global Burden of Disease Compare tool’- see http://ihmeuw.org/3hck. © 2013 University of Washington - Institute for Health Metrics and Evaluation (Global burden of Disease data 2010, released 3/2013)
Sierra Leone6
Annually, Sierra Leone loses over US$28 million in GDP to vitamin and mineral deficiencies. Scaling up core micronutrient interventions would cost less than US$4 million per year.
36% of children under the age of five are stunted, 21% are underweight, and 10% are wasted. Almost 1 in 4 infants are born with a low birth weight. Sierra Leone will not meet MDG 1c (halving 1990 rates of child underweight by 2015) with business as usual.
Sierra Leone exhibits higher rates of child stunting relative to some other countries with similar per capita income. That Zimbabwe, The Gambia, and Togo have much lower stunting rates demonstrates that it is possible to achieve better nutrition outcomes despite low income.
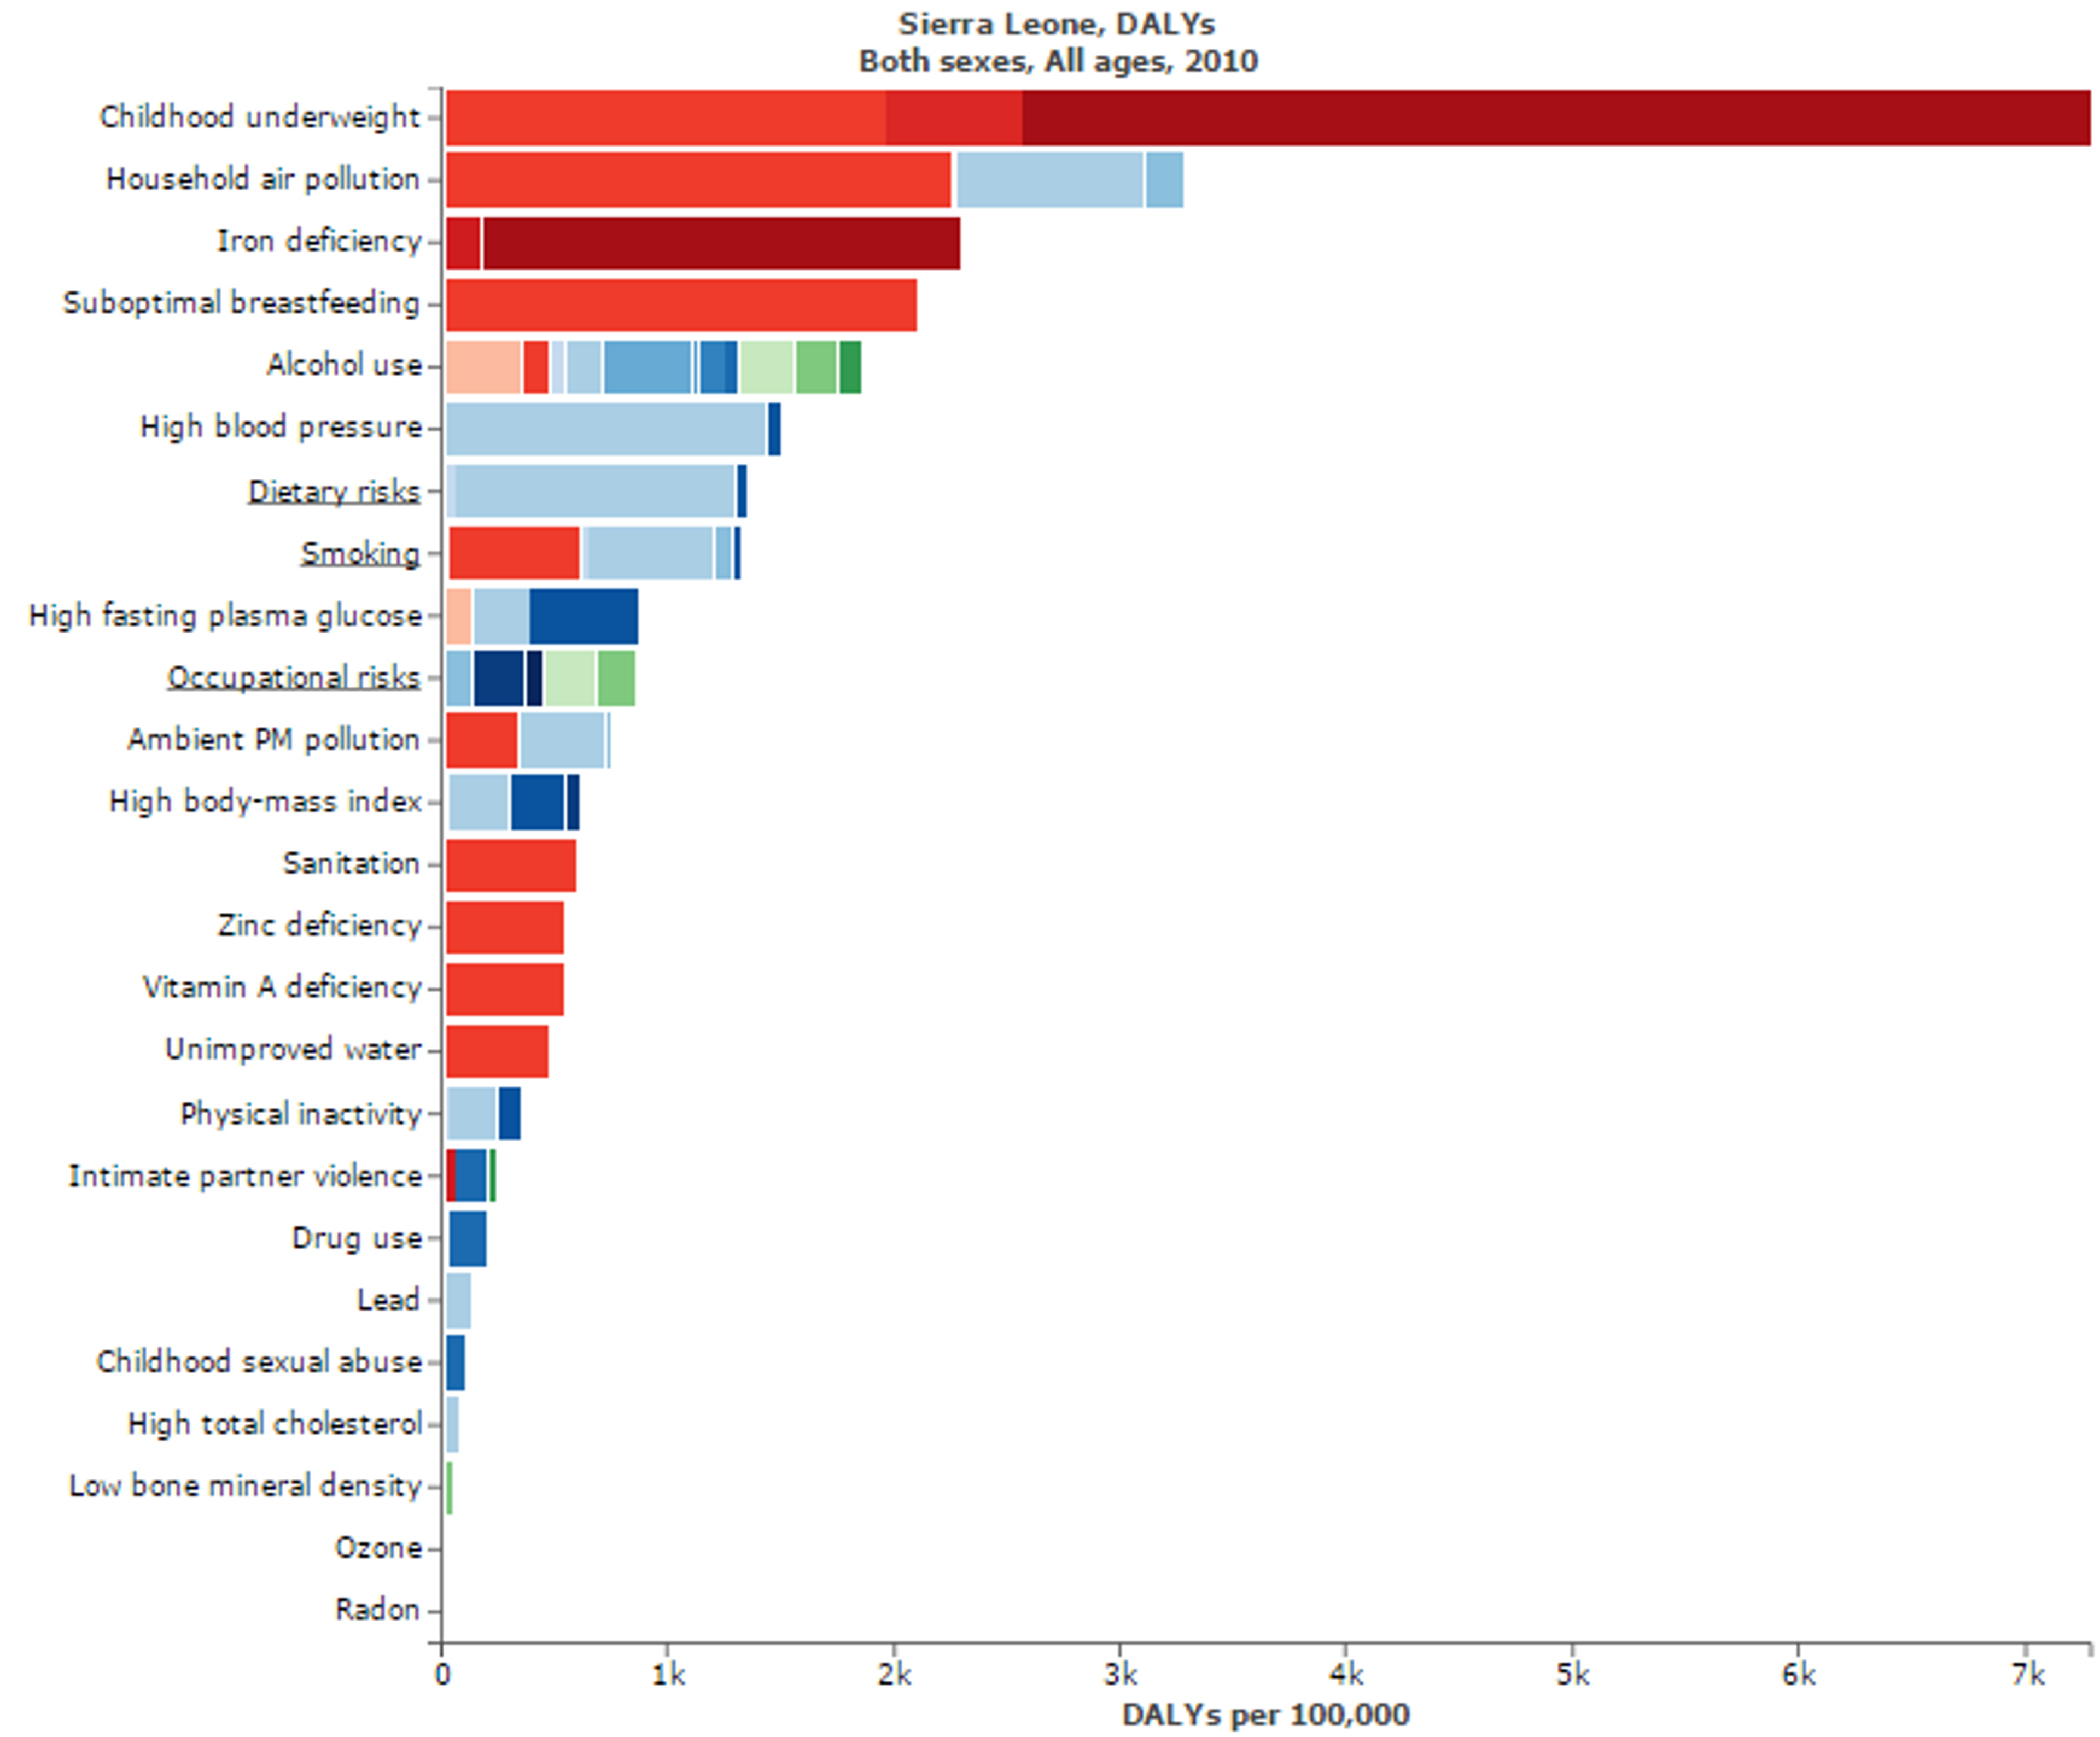
Figure 8: Figure shows risk factors for “Disability adjusted life years” in Sierra Leone. Micronutritional deficiencies, such as Iron, Zinc, and Vitamin A deficiencies, are substantial risk factors. Figure adapted with ‘Global Burden of Disease Compare tool’- see http://ihmeuw.org/3hck. © 2013 University of Washington - Institute for Health Metrics and Evaluation (Global burden of Disease data 2010, released 3/2013)
Updates on Room for additional funding
Long-term view on room for more funding
The data in Figure 17 suggest that, despite the potential for huge benefits, nutrition is grossly underfunded through aid 7.
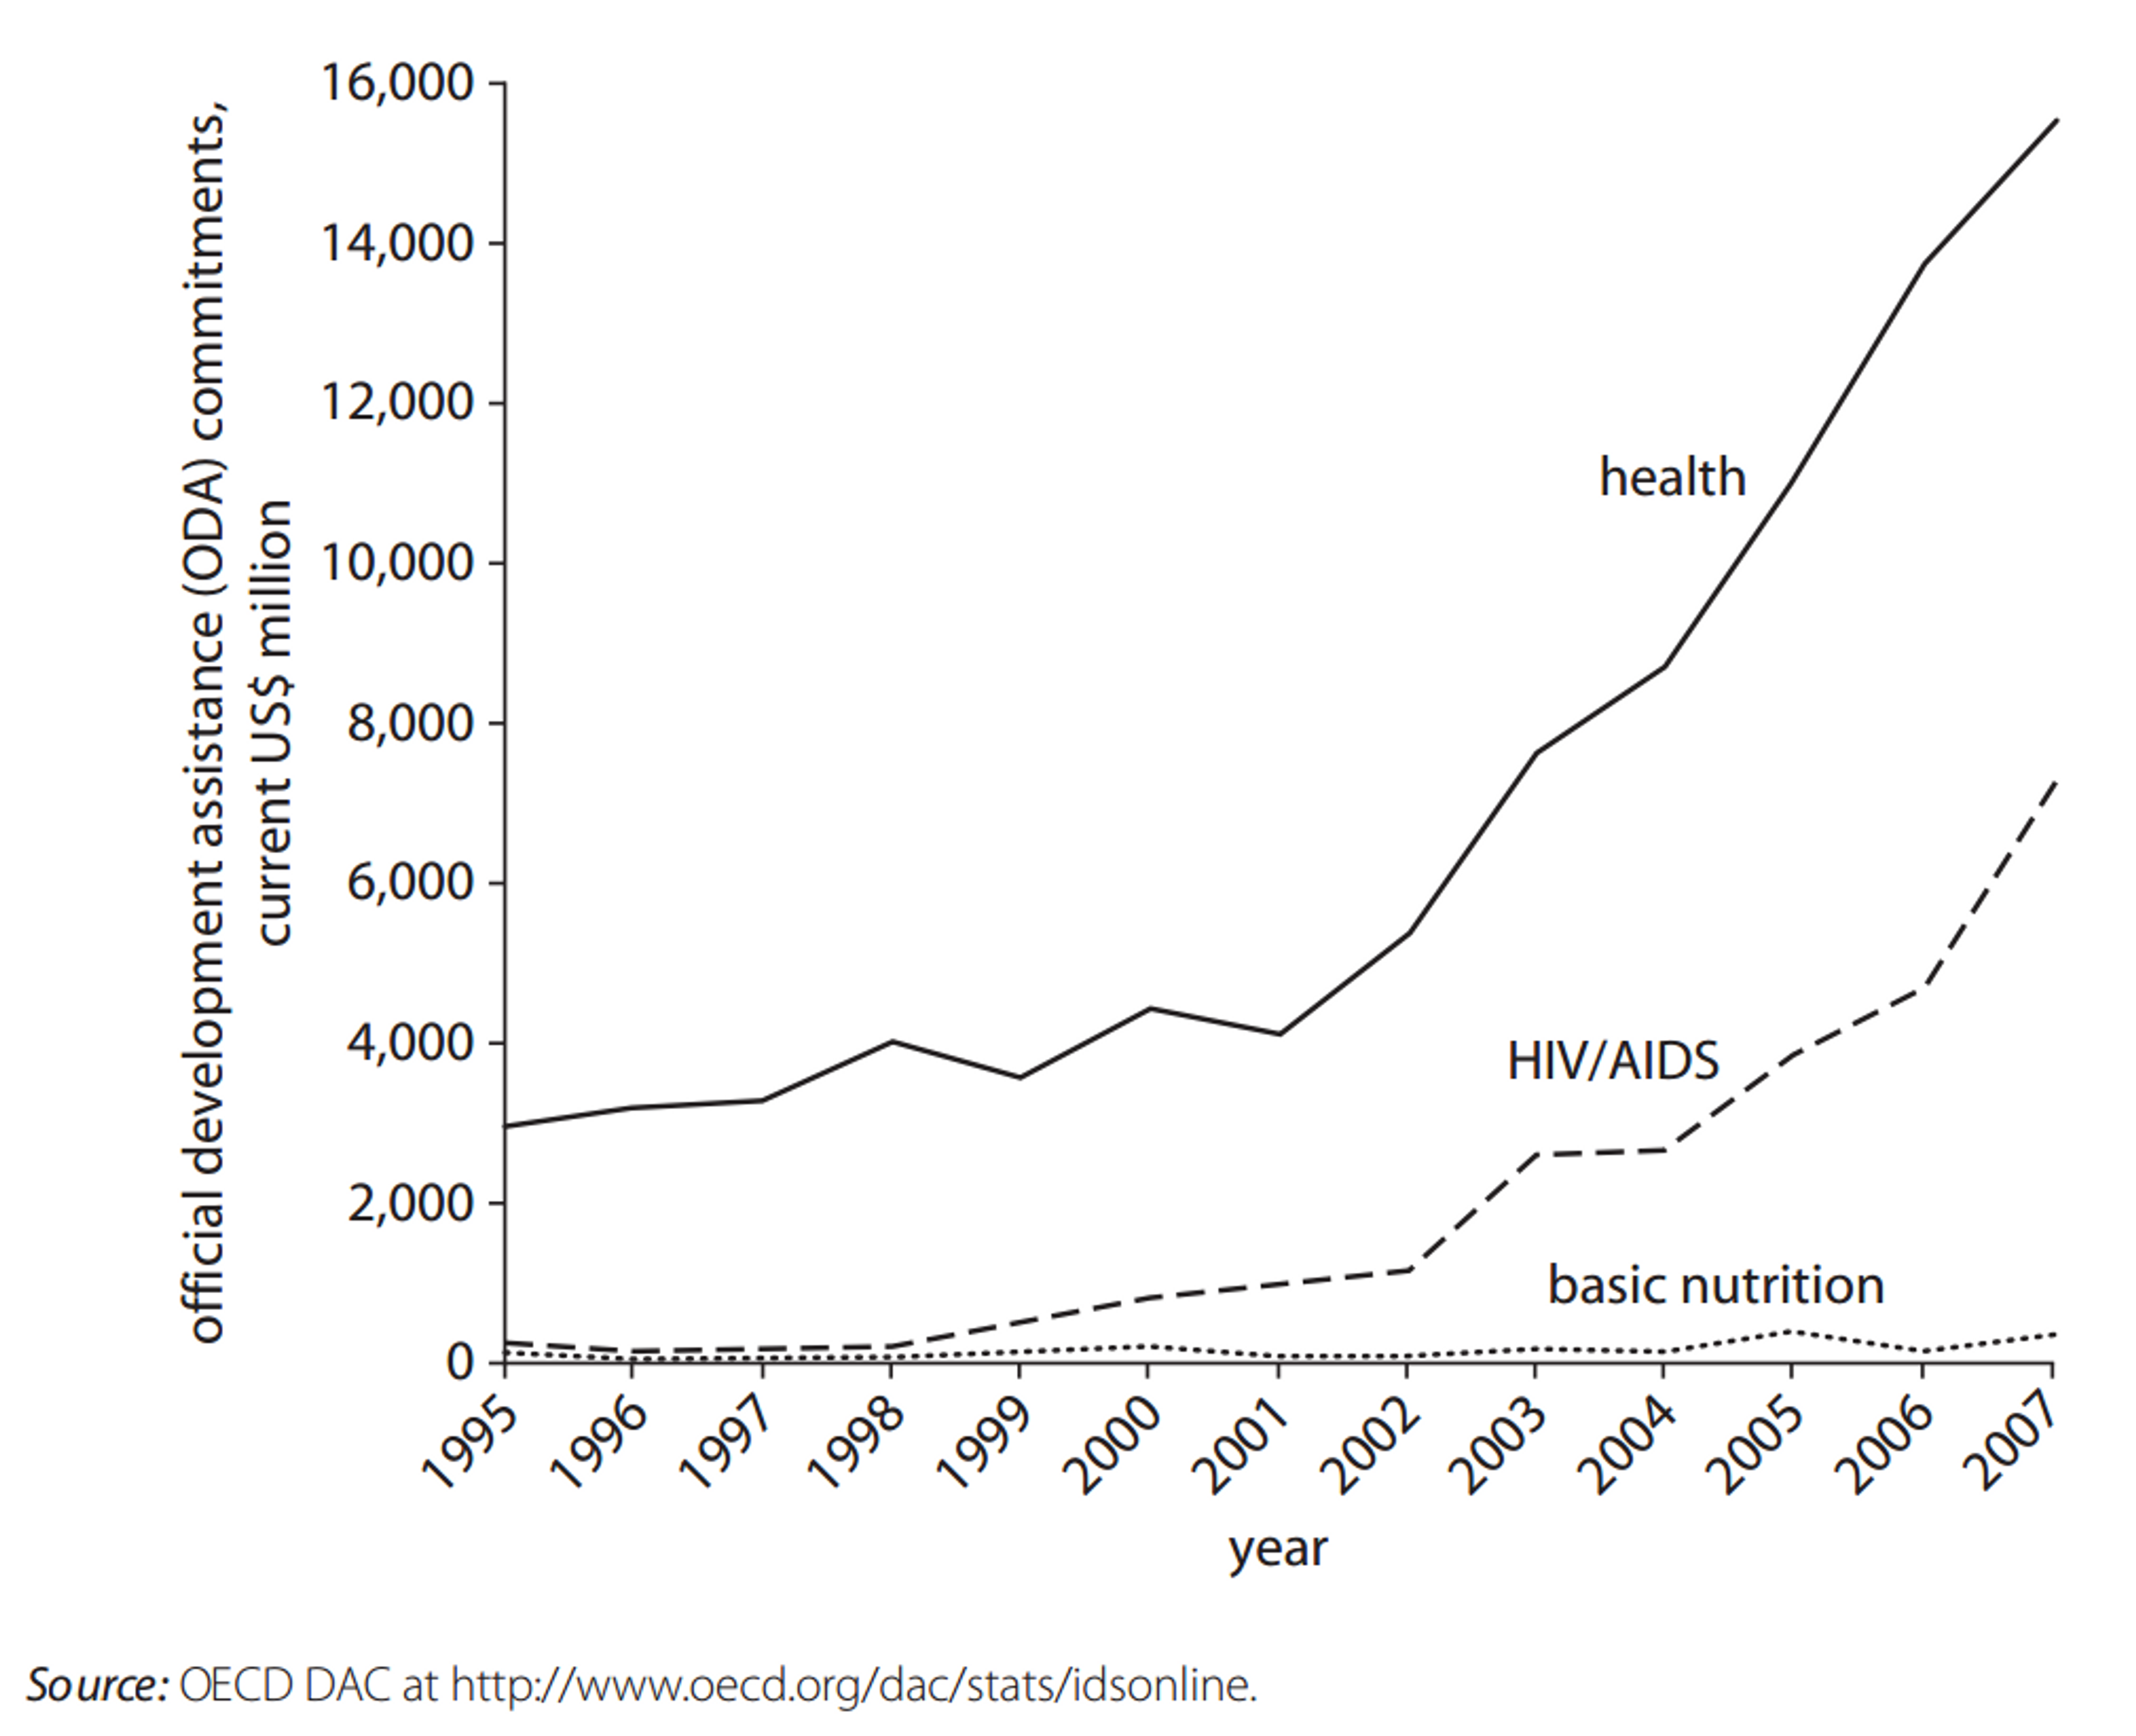
Figure 17 Official Development Assistance Commitments for Health, HIV/AIDS, and Nutrition, 1995–20078
Moreover, while aid for emergency food aid has increased dramatically (Figure 18), nutrition has remained chronically underfunded. 9

Figure 18 Official Development Assistance Commitments for Nutrition and Emergency Food Aid, 1995–200710
Finally, as can be seen in Figure 19, nutritional deficiencies might be under researched, insofar as the number of studies published in the Cochrane database is fewer than would be expected given the global DALY and mortality burden of nutritional deficiencies.
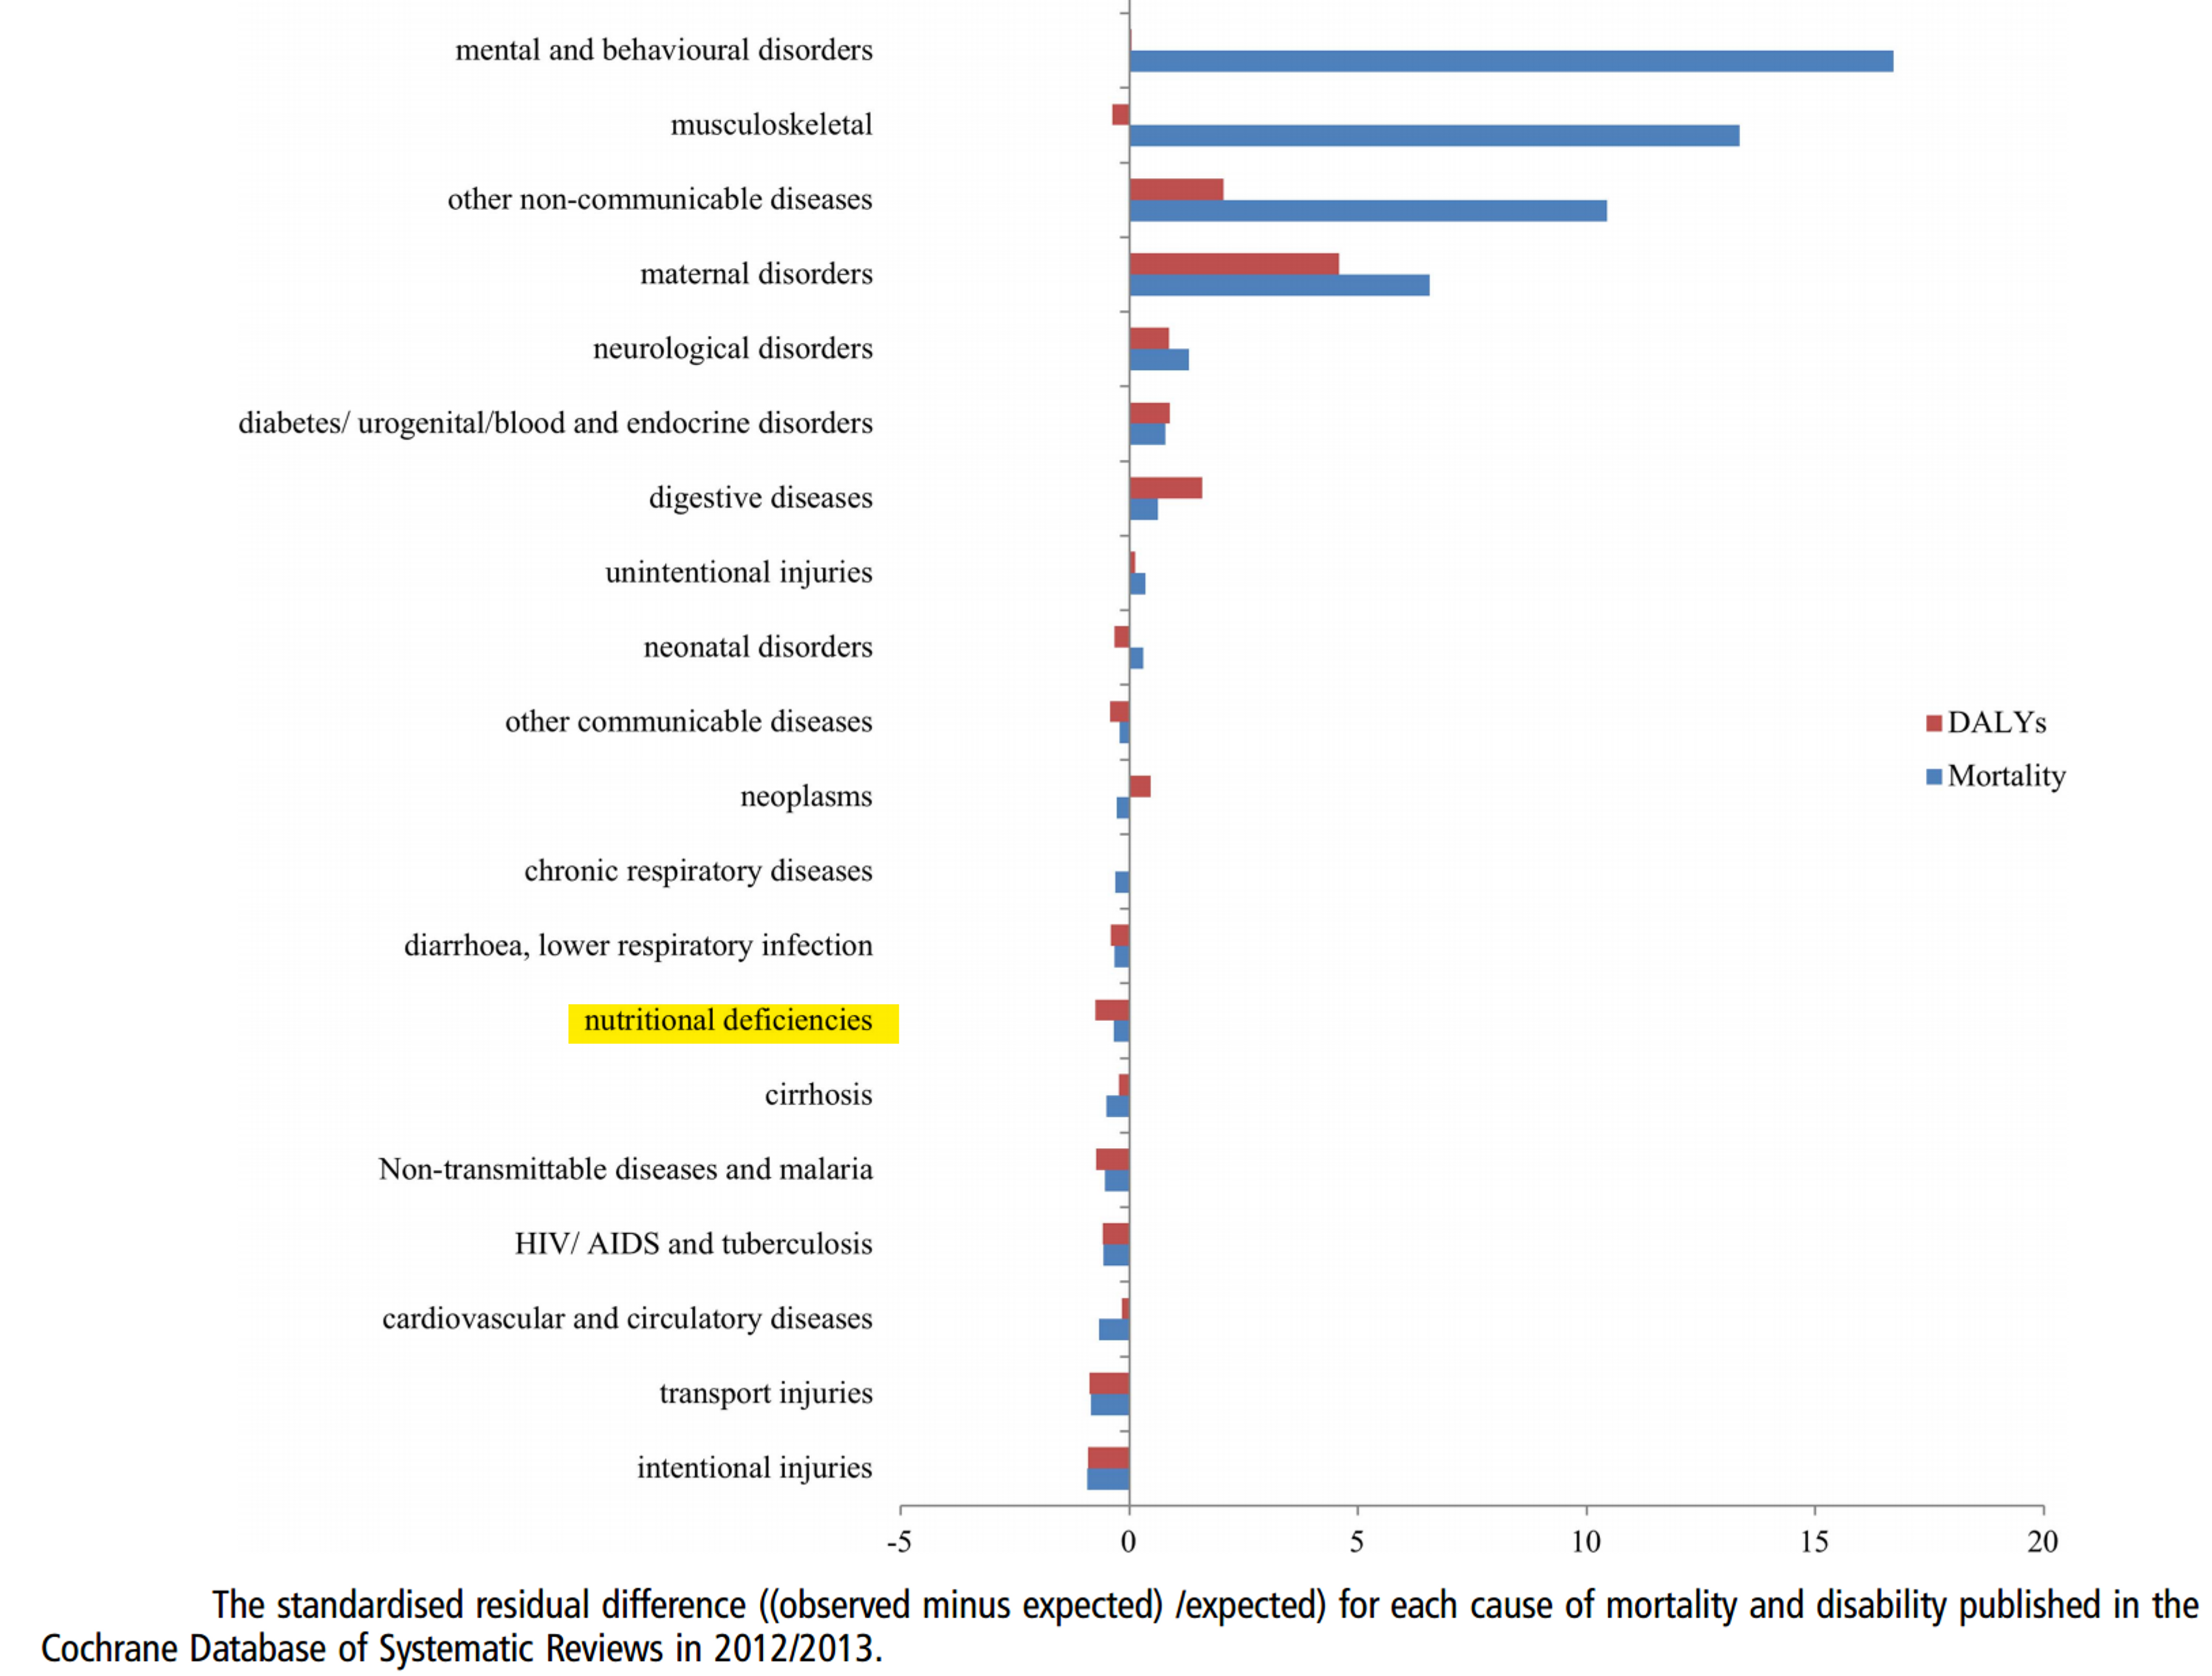
Figure 19: Nutritional Deficiencies are under researched in relation to their DALY and Mortality burden11.
How much more could be spend on nutrition? A recent review12 suggests that the total annual cost of achieving 90% coverage in the the 34 countries most affected by nutritional deficiencies would be around $9.6 Billion (see Table 3).
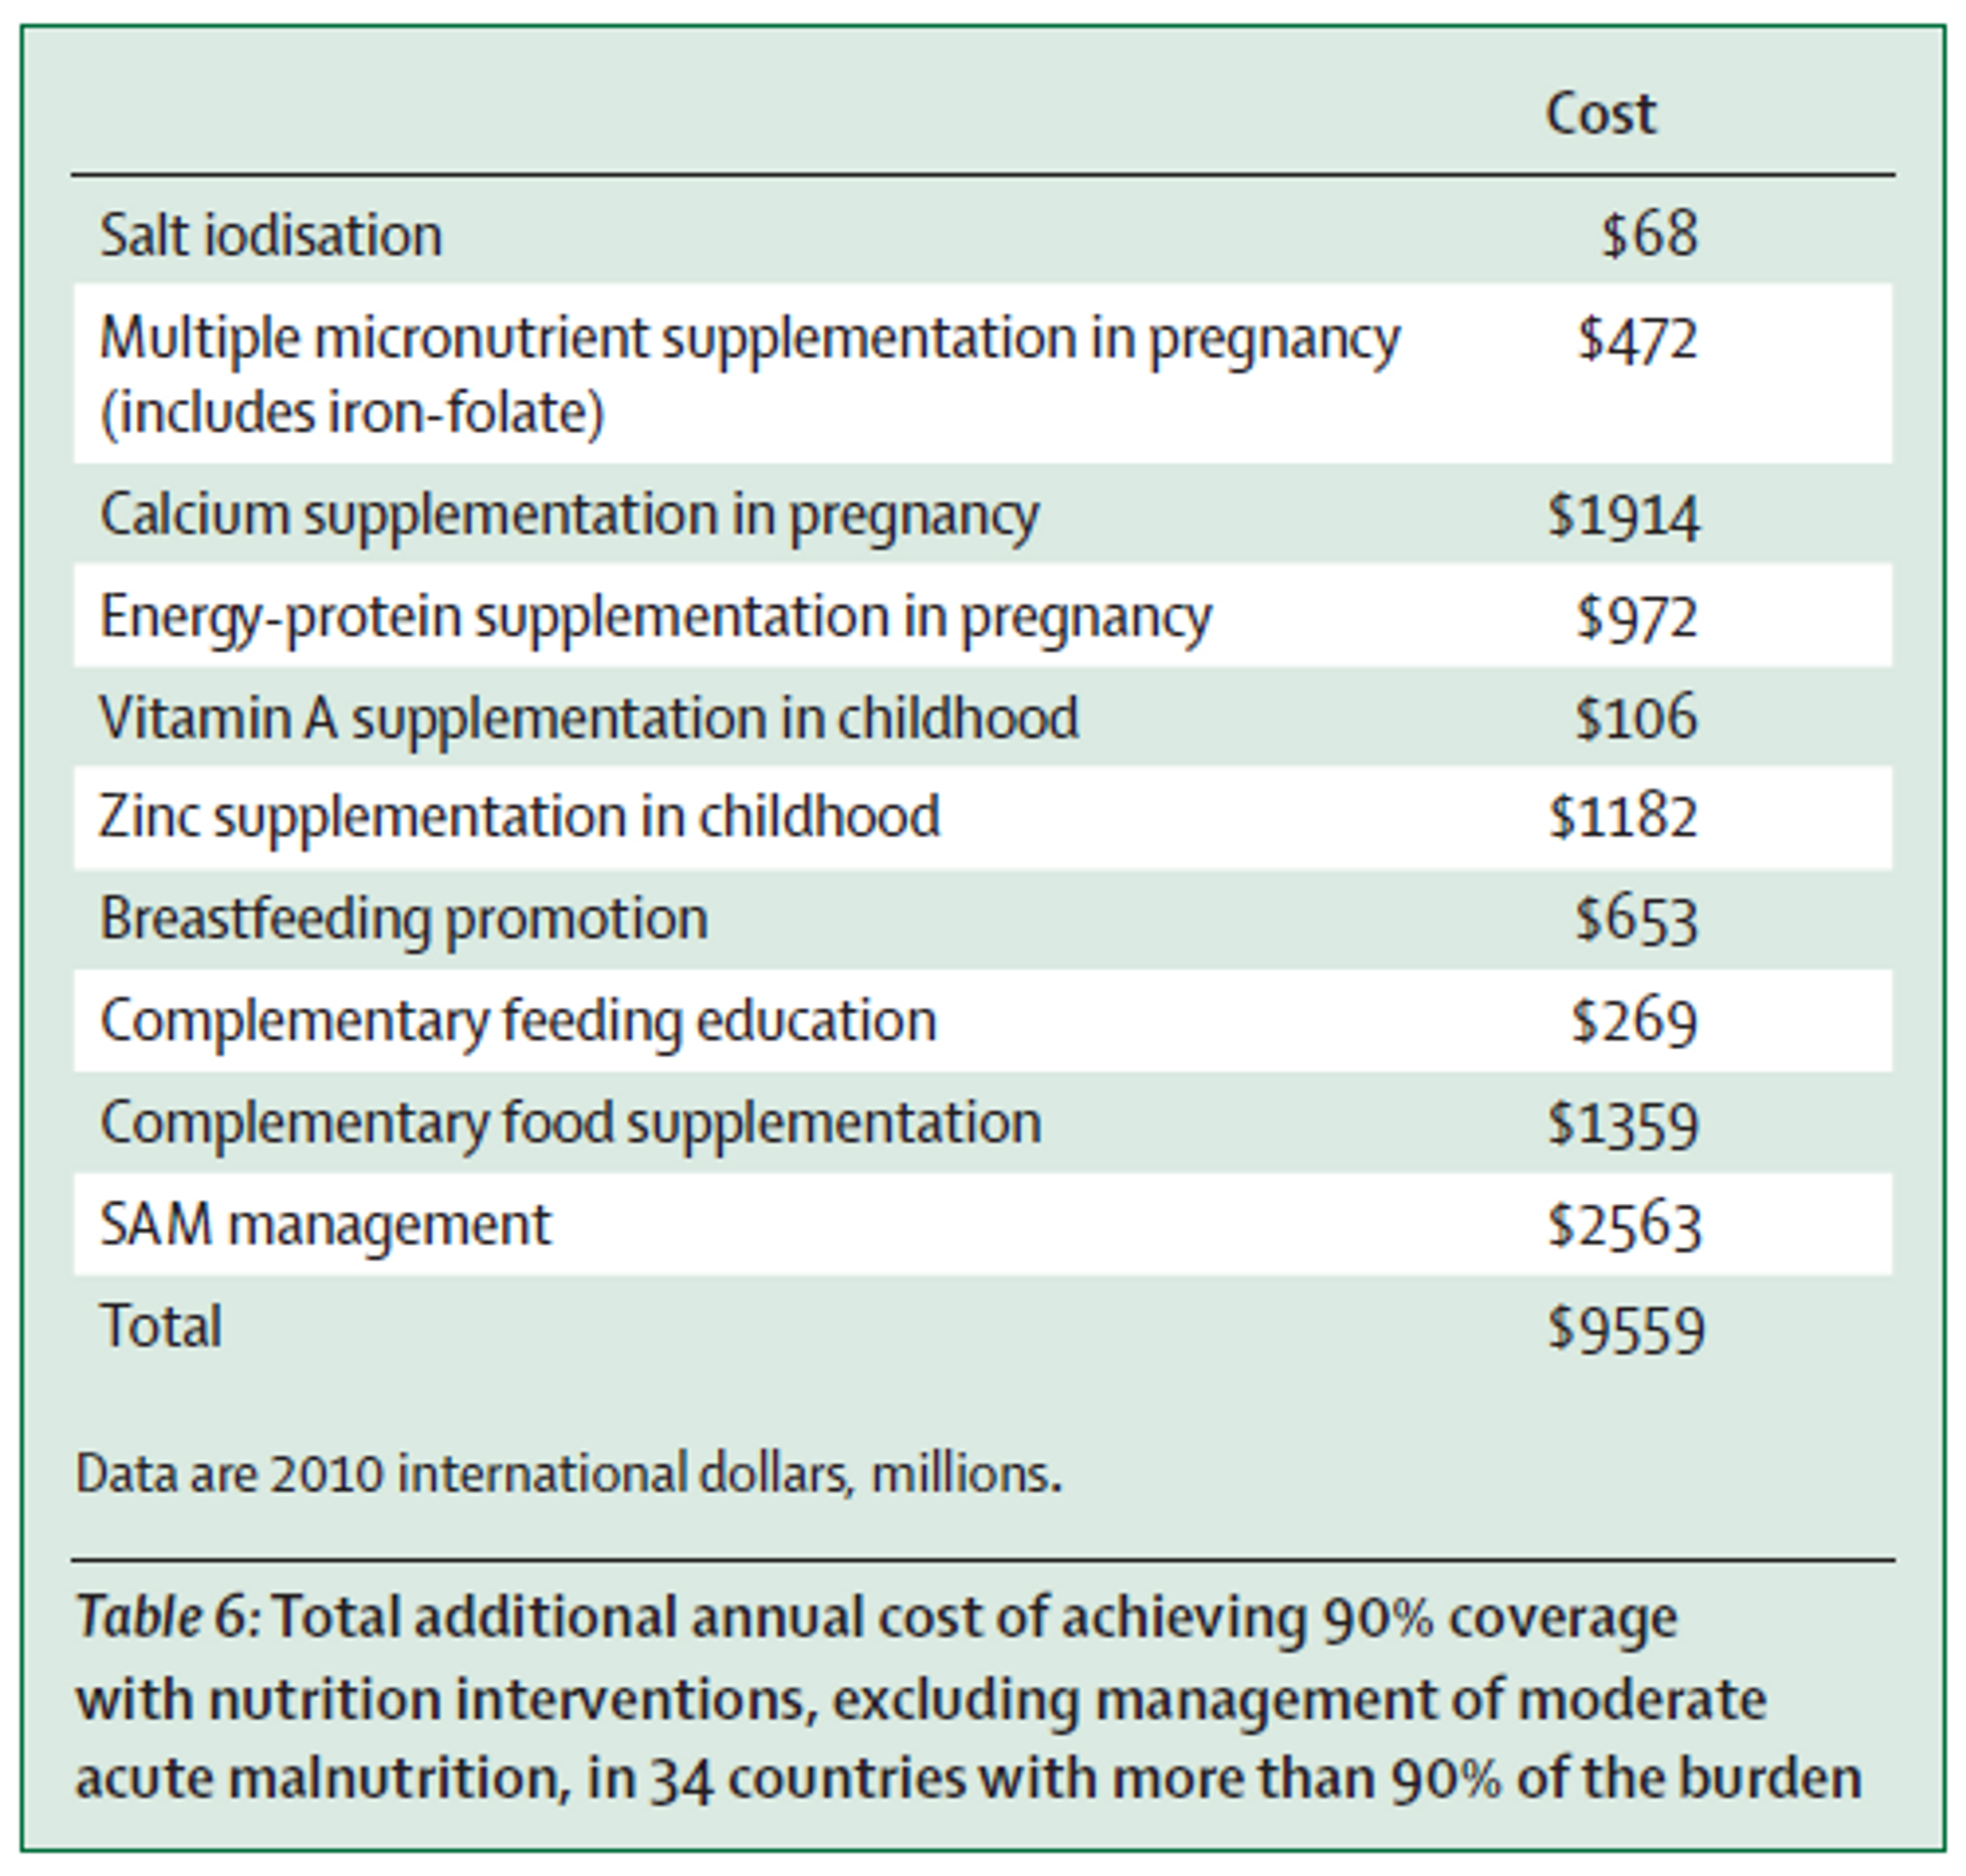
Table 3: Total additional annual cost of achieving 90% coverage with nutrition interventions, excluding management of moderate acute malnutrition, in 34 countries with more than 90% of the burden.
This estimate is in line with a World Bank study13 which estimated a funding gap of $10.3 billion per annum globally for scale-up of nutrition interventions. Closing this gap would provide preventive nutrition services to about 356 million children, save at least 1.1 million lives and 30 million DALYs, and reduce the number of stunted children by about 30 million worldwide. Another study by Bhutta et al. (2013) produced similar estimates.
Of course, not all of this money could be spent by PHC. However, we believe that PHC has substantial room for more funding, based on estimates of the cost required to implement micronutrient fortification in the countries where PHC is active. A recent World Bank report estimates that iron fortification of all staples in Sub-Saharan Africa would cost $130.5 million and salt iodization of all staples would cost $12.2 million per country. Although these costs would largely be paid for by the consumers of the fortified foods, there are substantial additional costs associated with full-scale implementation of fortification programs. Specifically, an additional US$50 million per year would be required for technical assistance, initial subsidy for fortificant, and social marketing for iron fortification and salt iodization; US$1.0 billion would be needed for capacity development for program delivery; and US$200 million for monitoring, evaluation, and operations research14. While these are projected worldwide costs, much of this investment would necessarily target Sub-Saharan Africa. Based on data from the World Bank, we estimate that the overall costs for scaling up micronutrient fortification programmes in countries where PHC is currently active (mostly small African countries), is around $33 million15.
A conversation in late 2012 between Givewell and a senior micronutrient adviser at UNICEF16, suggests that UNICEF does not have sufficient funding to meet every country’s need for Vitamin A supplementation. For instance, Uganda has solicited UNICEF and other donors for funding several times, indicating a strong need in Uganda for additional micronutrient funding, at least as of 2012. Other countries noted by the advisor as potentially having strong need for Vitamin A supplementation funding are Burundi, Comoros, Malawi and Rwanda. Project Healthy Children is currently active in all of these countries except for Comoros.
Other organisations involved in micronutrient fortification
We do not believe other organisations that are similar to PHC currently have as much room for additional funding as PHC. For instance, the Iodine Global Network (IGN) will receive approximately US $500,000 in funding from USAID in 201517 and Global Alliance for Improved Nutrition (GAIN) has funding from the Bill and Melinda Gates Foundation through mid-2015, which may also be renewed18. Moreover, PHC is only active in small African countries with small populations (<17 million), whereas GAIN is not currently active in these countries19.
Gates Foundation’s recent investment in malnutrition
The Gates Foundation recently announced a $776 million investment in nutrition, which will also unlock matching funds from the United Kingdom. At least some of this money will fund food fortification20. However, the focus will be on India, Ethiopia, Nigeria, Bangladesh, and Burkina Faso21, and so it does not include any of the priority countries in which PHC currently works. This increases our confidence that the marginal dollar donated to PHC will not go to an already crowded funding landscape. At the same time, the fact that the Gates Foundation (which is very much concerned about cost-effectiveness and has vast research capacity and expertise) is investing in food fortification increases our confidence that food fortification should be a priority intervention.
Short-term view on room for more funding
PHC currently holds about $200,000 in reserves22, which translates to about 3-4 months of operational costs, which we think is not excessive. Thus, in the short-term there is room for more funding. PHC has told us that with additional funding they would intensify their monitoring efforts, which is one of the most critical components to any national fortification program.
Updates on Fundraising activities
PHC has told us that their current fundraising activities involve ‘news blasts’ and quarterly letters to current and previous donors. Yet it would seem that PHC has received less funding from private foundations and private donors than one might expect given the organization’s effectiveness, reputation, and room for additional funding. Therefore it may be a good idea for PHC to use additional resources to attract more funding (additional resources directed to non-program activities would not necessarily make Giving What We Can less likely to recommend donating to PHC; we assess charities based on overall effectiveness rather tha exclusively on overhead costs). PHC is also now in the process of being evaluated by Givewell, which is a very good opportunity for them to receive increased exposure and funding.
Updates on PHC’s Operations
Fortification programs
Our colleagues at Givewell provide a great general overview of PHC’s operations in form of a conversation note with PHC’s Chief operating officer, Laura Rowe.
PHC reports its fortification program in Rwanda is almost completed and operations are being handed over to the local government. PHC’s efforts are now focused on industry engagement, consumer and policymaker awareness, and establishing an institutionalized monitoring and evaluation system23. They report that in 2015, priorities in Rwanda will be to (1) continue to support appropriate sourcing of equipment and premix; (2) secure gap funding where needed; (3) guide appropriate testing, monitoring, and reporting structures within industry and at the government level to track compliance; and (4) ensure the design of a surveillance system to track coverage and ultimately measure the impact of fortification on micronutrient status. Finally, PHC is working closely with the Rwandan Ministry of Health to secure funds for the hiring of a short-term Fortification Monitoring Specialist to be placed within the government to guide the program through this critical, post-implementation phase.
Similarly, in Sierra Leone, where PHC has been active since 2014, PHC reports that they are supporting the Ministry of Health in (1) drafting relevant fortification policies; (2) designing training protocols for inspectors of fortified foods; (3) creating advocacy structures; and (4) developing appropriate monitoring and reporting systems24.
Acknowledgements
Thanks to the scientists who have given their expert opinion on different parts of this report.