Determining the cost-effectiveness of climate change interventions
Giving What We Can no longer conducts our own research into charities and cause areas. Instead, we’re relying on the work of organisations including J-PAL, GiveWell, and the Open Philanthropy Project, which are in a better position to provide more comprehensive research coverage.
These research reports represent our thinking as of late 2016, and much of the information will be relevant for making decisions about how to donate as effectively as possible. However we are not updating them and the information may therefore be out of date.
Note that more recent research from other sources can be found here:
- Founders Pledge Climate Change Report
- Review of Climate Change Cost Effectiveness Analyses
- Global development interventions are generally more effective than climate change interventions
When it comes to choosing between cause areas and choosing where to donate, it’s obviously quite important to have some idea of how cost-effective different interventions are. That’s largely why GiveWell and Giving What We Can do research in the first place. But to work out the cost-effectiveness of an intervention, we need to have a reasonably good idea of what the impacts (particularly quantitative impacts) of that intervention will be. For climate change interventions, many of which currently focus on directly mitigating greenhouse gas emissions, this is a major problem and one for which there is yet to be a satisfactory solution. This is largely due to the extreme degree of uncertainty which plagues the modelling of climate change and, in particular, its predicted impacts.
In this post, I’ll aim to answer the question of exactly what impact climate interventions could have. This answer will still be subject to an enormous degree of uncertainty - such that it may be an enormous overestimate, or perhaps an enormous underestimate, of cost-effectiveness. But, still, it is useful to have some sort of explicit figure from which we can begin to compare climate change mitigation to other interventions. However, the estimates produced suggest that climate change mitigation has quite poor cost-effectiveness relative to other humanitarian interventions. Given this, when uncertainty arises, I’ve opted for assumptions which are extremely generous to climate change mitigation, and to charities which work on it, which will produce quite a low estimate of cost (in fact, an estimate which is likely to be quite close to the lower bound of cost, and the upper bound of effect). From these assumptions, I’ve put together a basic model to calculate human lives saved by mitigating emissions - you’ll find it here, so feel free to test it out and see what your impact might be when you donate to climate charities. The methodology and reasoning behind it is explained in the rest of this post. Also, the choice of human lives saved as a metric is primarily due to the lack of sufficiently comprehensive quantitative data on other impacts of climate change - the effects of climate change on human suffering more broadly, on animal suffering, on biodiversity, on the natural environment and the total effects of climate change in expectation (including low-probability catastrophic risks). These are all promising topics for future research and I’ll suggest below how my model might be employed to evaluate other effects such as these. Nonetheless, taking human mortality as a starting point may be useful to demonstrate just how it might be possible to model these other effects and how to direct future research.
Unfortunately, specifically for saving human lives, our modelling suggests that the best known climate change mitigation interventions do not turn out to reduce the health impacts of climate change at low cost, or anywhere near as cost-effectively as our current top charities - this is even so when we make those quite generous assumptions and produce what is a very low estimate on the cost per life saved. This may mean that political advocacy is a better option for having an impact in this area, or that simply dealing with the effects of climate change is more effective. However, these conclusions may not apply for donors who place much greater importance on biodiversity, animal welfare and preservation of the natural environment than on human well being, so climate change mitigation may still be a relatively cost-effective intervention for improving outcomes in these areas.
The old estimates
If you’re familiar with our old climate change evaluations, you might recall the previous estimate of the marginal impact of CO2-equivalent emissions. From the World Health Organisation’s (WHO) 2002 Global Burden of Disease study, it was estimated that 5,000 tonnes of CO2-equivalent emissions resulted in, on average, 1 DALY.[^fn-1] While this did provide a very useful basis for comparing climate charities to our recommended charities, which work primarily on health in the developing world, it was subject to a large degree of uncertainty and may not have been as reliable as it appeared (though, of course, the estimates made in this post are also subject to great uncertainty).
Uncertainty, however, is not the only problem with the old figure. It is based on data collected in 1999,1 at 1999-levels of warming and 1999-levels of mortality, and is hence extremely out of date. The figure of 5000t/DALY is also estimated quite crudely - up until 1999, 1016t of CO2-equivalent had been released, and 5.5 million DALYs were attributable to climate change each year.2 Averaging this out, 1tCO2eq corresponds with an estimated 0.0000054 DALYs per year. Over 200 years, and discounting future values by 3% per year, we have the figure of more than 5000tCO2eq/DALY.3 Now, if we assume that all greenhouse gases result in warming and health impacts immediately upon their emission (although they don’t),4 that they accumulate in the atmosphere and remain there indefinitely (they don’t),5 that the relationships between emissions and temperature and between temperature and health impacts are both linear over the entire history of anthropogenic emissions (this is unlikely), that the impact per tonne of emissions is hence the same in 2016 as it was in 2000 (again, unlikely), and that there have been no new insights into the potential disease burden of climate change in the past 16 years, then this might be a somewhat accurate figure. Given that these assumptions are all either clearly false or extremely implausible, it seems that the estimate of 5000t/DALY may be somewhat lacking.
In particular, this figure, which is somewhat crudely extrapolated from the average impact of emissions as of 1999 fails to accurately estimate the marginal impact of additional emissions on temperature and therefore on health. Accepting that either of these relationships may be non-linear over our entire emission history, it holds very little value in predicting the impact of further emissions and of present mitigation efforts. Given that it is also 16 years out of date, and makes the implausible assumptions listed above, it seems that we do require a new estimate if we are to use it as a basis for our evaluations of both charities and cause areas.
Unsurprisingly, the WHO does not currently refer to this figure in their literature at all, nor do the wider scientific community. Given this, it seems reasonable to accept that it is not a figure which the WHO currently endorses nor one which is widely considered to be highly credible.
Have there been any new estimates since then?
Not really.
Specifically, there haven’t been any studies in the past 16 years which quantify the impact of climate change on global health in DALYs and in a per-tonne figure. Producing quantitative estimates of the exact mortality and morbidity impacts of climate change (and of present emissions) is still a relatively neglected area. A plentitude of research has been conducted into whether climate change is likely to have particular impacts, with the IPCC reports detailing many of these (including extreme weather events, food shortages, water scarcity, increased disease prevalence, and many others),6 yet there is far less research detailing the exact scale of these impacts globally and of the human morbidity and mortality they are likely to cause.
Some related research
Despite the lack of quantitative estimates of health impacts per tonne of emissions, there has been quite a large volume of work done on evaluating the Social Cost of Carbon (SCC). That is,“...the incremental aggregate economic impact of emitting one more tonne of carbon dioxide…” at present,7 in dollars. Values of the SCC range from $4 in some cases, to $37 in others, to suggested lower bounds of over $100, to upper central estimates of $205, to some some estimates over $100,000.89101112 However, this is ill-suited for our purposes as it:
- a) expresses only the economic costs of climate change, which, though important, will not be the primary moral concern for many (and which are not the central focus of the research conducted by Giving What We Can or similar organisations);
- b) is produced by a variety of different models about which there is a large degree of uncertainty and disagreement, and almost all of which are quite opaque in exactly how they evaluate impacts, particularly health costs and lives lost;13141516 and
- c) is quite often generated from various economic assumptions which are morally or empirically questionable - for instance, that the impact of a death is proportional to an individual’s income rather than equal across national and economic groupings (the widely used FUND model simply values a death as 200 times an individual’s annual income, making the lives of those in developed countries tens of thousands of times more valuable than those in the poorest countries),1718 that the impact of climate change on crop yields will be overwhelmingly positive (despite a great deal of evidence to the contrary),192021 and the omission of major humanitarian impacts such as extreme weather events.22
Another notable exception to this, is the WHO’s 2014 report Quantitative risk assessment of the effects of climate change on selected causes of death, 2030s and 2050s.23 This report details the predicted impacts of climate change on mortality in a variety of major areas, although these areas are not exhaustive nor are any estimates made of the impact per tonne of CO2eq emitted.
What do we know about mortality due to climate change?
We know that unmitigated climate change will lead to more extreme weather events, decreased crop and fishing yields, risks to food security, water shortages, greater prevalence of a range of diseases, and extensive effects on biodiversity (see our full report on climate change for details). We do not, however, know quite as much about exactly how much human morbidity and mortality, quantitatively, climate change is likely to cause.
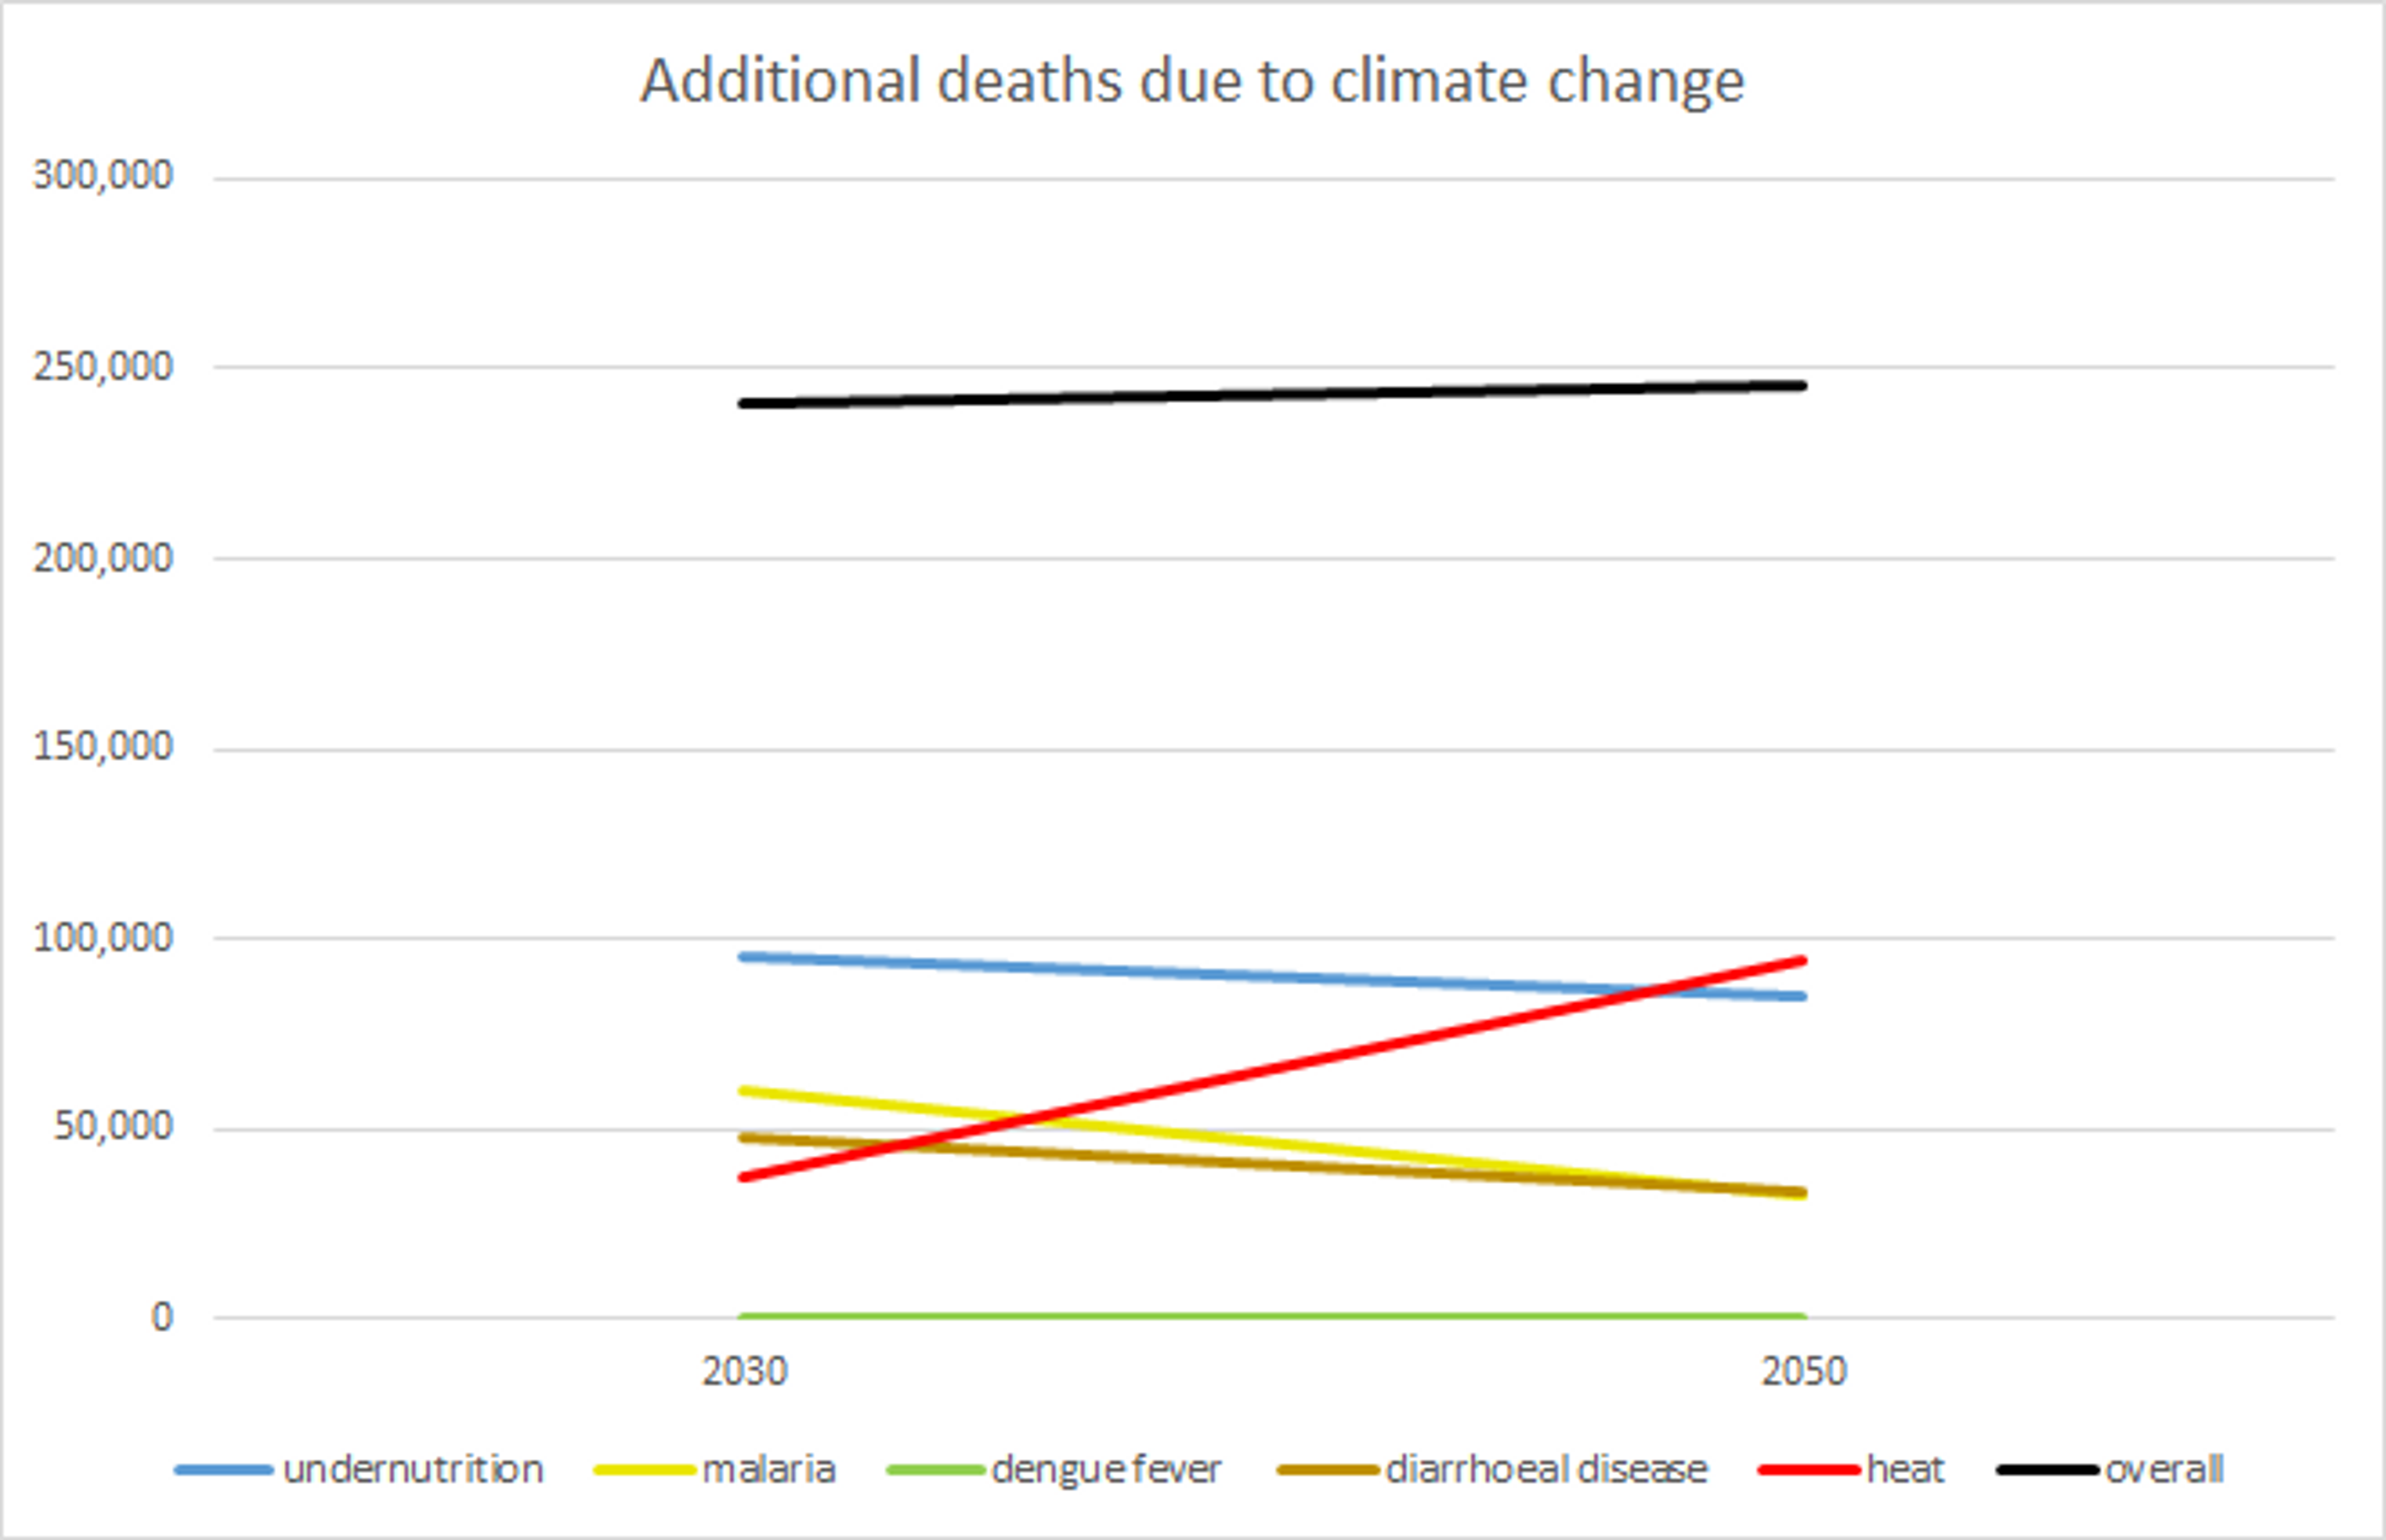
The best indication we currently have, however, comes from the WHO’s 2014 Quantitative Risk Assessment,24 in which projections are made for the causes of death expected to be most exacerbated by climate change over the next century. These include: heat-related mortality; coastal flood mortality; diarrhoeal disease; malaria; Dengue fever; and undernutrition. Mortality due to each of these factors is estimated for the year 2030 and the year 2050 under the A1B business-as-usual (BAU) emissions scenario25 and the base case socioeconomic scenario (although the choice of emissions scenario makes little difference, due to the long delay between emission and atmospheric warming).26
Specifically, in 2030, we can expect climate change to result in the following (with the range from lowest to highest projections, based on different levels of warming and impact observed in simulations, in brackets):27
- 95,176 additional deaths due to undernutrition among under-5s (-119,807-310,156);
- 60,091 additional deaths due to malaria (37,608-117,001);
- 258 additional deaths due to Dengue fever (136-331);
- 48,114 additional deaths due to diarrhoeal disease among under-15s (21,097-67,702);
- 37,588 additional deaths due to heat exposure among over-65s (26,912-48,390); and
- An increased risk of mortality from coastal flooding, though much of this can be alleviated with adaptation (with sufficient coastal defences, the mortality due to coastal flooding may be negligible) and actual mortality figures are subject not only to extreme uncertainty but also a degree of randomness.
This equates to 241,227 additional deaths each year in the first five cause areas (-34,054-543,580).
In 2050, BAU emissions can be expected to result in:28
- 84,697 additional deaths due to undernutrition among under-5s (-29,203-163,989);
- 32,695 additional deaths due to malaria (22,786-40,817);
- 282 additional deaths due to Dengue fever (195-342);
- 32,955 additional deaths due to diarrhoeal disease among under-15s (14,914-49,151);
- 94,621 additional deaths due to heat exposure among over-65s (70,775-126,684); and
- An increased risk of mortality from coastal flooding, as above.
This equates to 245,250 additional deaths each year in the first five cause areas (79,467-380,983).
Figure 1: Additional deaths due to climate change, based on mean estimates from WHO’s Quantitative Risk Assessment.
These projections are obtained from five different climate models - BCM2.0, EGMAM1, EGMAM2, EGMAM3 and CM4v1 - as well as various empirical-statistical models and other tools in each of the six areas.29 The projections for these areas, then, are considered relatively robust (of the methods available), despite the large range between highest and lowest estimates.30
However, a primary limitation of the WHO’s assessment is that it was unable to consider other causal pathways by which climate change might increase morbidity and mortality - major heatwave events, cyclones, river flooding, water scarcity, economic burdens, migration, conflict, loss of biodiversity and habitats, other diseases such as schistosomiasis, and various others.3132 This is largely due to the fact that current models are simply unable to account for such wide-ranging effects, which is unfortunate. Despite this, when considering the total effect of climate change on mortality below, we will still be able to establish a reasonable upper bound on these pathways.
Nonetheless, the WHO’s projections are still very useful. We can very roughly estimate from their figures what the total health burden due to climate change might look like, although this does introduce additional uncertainty to our prediction. At present, four of the six pathways described above (undernutrition, malaria, Dengue fever, and diarrhoeal disease) cause more than 5.117% of total deaths worldwide (with a 95% confidence interval of 4.39%-5.85%).33 In more detail, malaria causes 1.56% of all deaths (1.28%-1.87%), diarrhoeal disease causes 2.3% (2.11%-2.51%), Dengue fever causes 0.017% (0.01%-0.02%), and nutritional deficiencies cause 1.24% (0.99-1.45).34 Coastal flooding and heat exposure are omitted, as neither is easily distinguished in the Global Burden of Disease study.35 From this, we can quite roughly estimate that mortality due to climate change might grow proportionally to current levels of mortality - that is, that these diseases which currently make up 5.117% of global mortality will make up 5.117% of additional mortality due to climate change and, hence, that deaths due to climate change are 19.54 times higher than estimated in the WHO’s assessment. This equates to 4,714,227 additional deaths due to climate change in 2030 and 4,792,847 additional deaths in 2050. Taking the highest estimates of both mortality and the lowest of percentage disease burden, we get a maximum possible death toll of of 12,382,232 in 2030 and 8,678,428 in 2050**.**
This is likely to be an extremely generous assumption to make. The WHO selected those pathways as being among those through which climate change is likely to have the greatest impact on human mortality.36 Other factors which contribute heavily to global mortality, such as cancers (15.01% of all deaths), neurological diseases (3.6%), self-harm (1.54%), and most non-communicable diseases (69.75%) are presumably far less likely to be exacerbated by temperature increases. Of course, deaths due to natural disasters (a mere 0.035%), armed conflict (0.057%), dehydration, starvation and so forth may all increase at a greater rate than those considered above, but these make up a miniscule portion of total deaths. If we are approximating that all causes of death will increase by the same factor, but with more than 70% of the total accounted for by diseases which are unlikely to be affected by climate change, these other causes would need to increase by almost two orders of magnitude more than the causes analysed by the WHO. That is, deaths due to natural disasters and armed conflicts would have to not only increase just as much as deaths due to malaria and heat stress, but also increase by almost two orders of magnitude more than malaria and heat stress. Given that these causes considered by the WHO are likely to be among those which increase the most, it is extremely unlikely that deaths due to these other causes will increase anywhere near enough to counterbalance the 69.75% of deaths accounted for by non-communicable diseases (plus the large percentages accounted for by other causes unlikely to be affected by climate change). Given this, predicting that mortality will increase at the same rate across all causes of death is almost certainly an enormous overestimate of the impact of climate change, but this will allow us to establish a very high estimate as well as an upper bound on additional mortality.
In addition, the diseases responsible for 5.1% of deaths which will be exacerbated by climate change do not include heat deaths, which make up the largest portion of additional deaths expected in 2050. Thus, the true figure is greater than 5.117% and, by assuming that all causes of death will increase at the same rate, this further overestimates how much we need to multiply the WHO’s mortality figures by to reach the true figure. Given this and the large overestimate involved in assuming the same growth in mortality for all causes of death, it can hence be supposed that 4,714,227 additional deaths in 2030 and 4,792,847 additional deaths in 2050 are very high estimates and that 12,382,232 in 2030 and 8,678,428 in 2050 are likely to be rigid upper bounds.
Using this to model the per-tonne effect of emissions
Now we have upper bounds and high estimates for the overall mortality due to climate change in both 2030 and 2050, but this does not yet tell us what impact we can have by reducing our own emissions or by donating to mitigation efforts.
To begin with, under the A1B emissions scenario which is used to produce the WHO’s estimates, global emissions in 2016 are roughly 50GtCO2eq (with a low estimate of 45Gt),37 or equivalent to 50 billion tonnes of carbon dioxide.
Next, we need some idea of how long it will take for emissions in our present year to affect temperature and, thereby, increase mortality through the pathways of undernutrition, malaria, Dengue fever, and diarrhoeal disease. It has been found that, due to the thermal inertia of Earth’s oceans, 60% of the warming attributable to an amount of carbon dioxide being emitted occurs between 25 and 50 years after the emission takes place, for which the midpoint is 37.5 years.38 So, for instance, it is likely that much of the effect of present emissions in 2016 will not be felt until 2054 (or 2041-2066) - not too far outside the 2030-2050 period examined by the WHO. However, this will not affect our calculations at all if we do not apply discounting (see below).
Also, it is estimated that present emissions of carbon dioxide may result in raised atmospheric concentrations and temperature for roughly 500-1000 years, with roughly 80% removed from the system within 200 years (the ‘turnover time’ or ‘mean residence time’ of individual CO2 particles in the atmosphere is much shorter, at 3-4 years, but this is largely irrelevant due to the ongoing cycle of carbon particles between the atmosphere and oceans/vegetation/soil).394041424344 In addition to this, we know that the relationship between cumulative tonnes of CO2-equivalent emitted and temperature rise before 2100 is very nearly linear, ensuring that temperature rise will be very nearly proportional to the amount emitted.4546
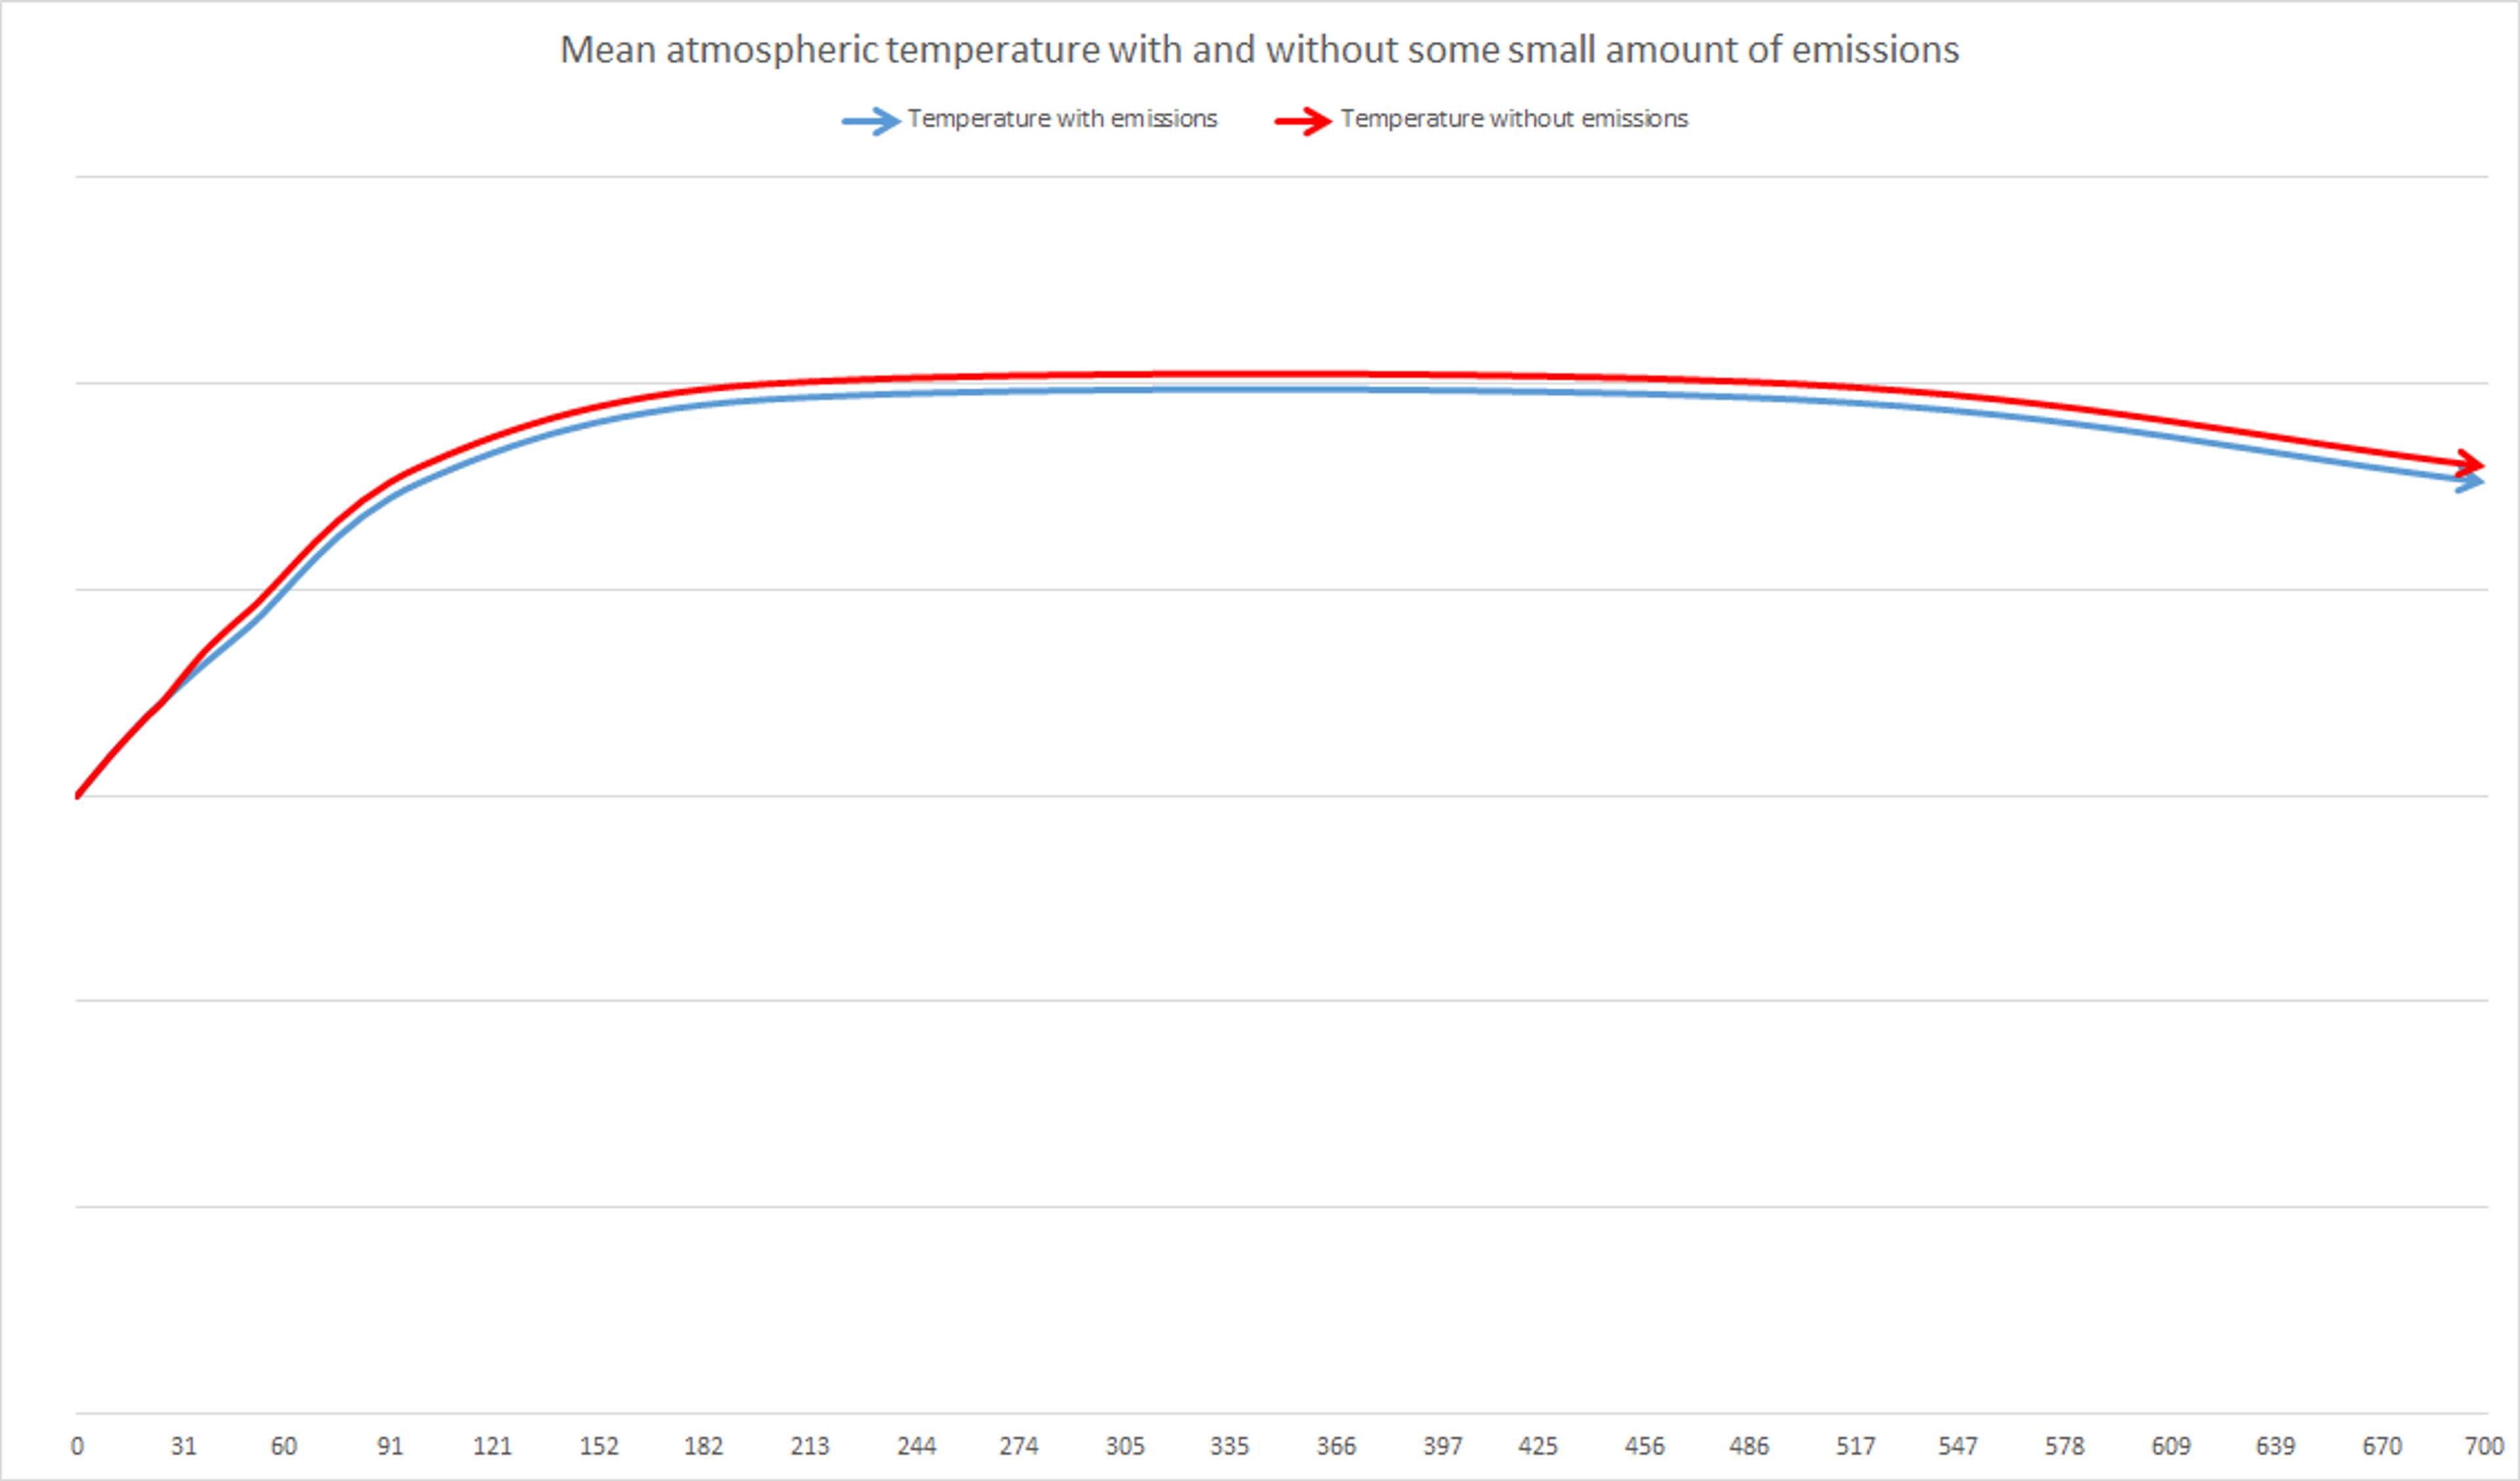
Given all of this, the impact of this year’s emissions will be some additional warming occurring, for the most part, between 25 and 50 years in the future. As atmospheric temperature increases, the marginal impact of present emissions will be, roughly, to raise temperatures by some small additional amount between 25 and 50 years after, and that temperatures will remain slightly higher for the remainder of time during which the warming effect of those emission emissions persist (i.e. for roughly 500-1000 years). This is illustrated below in Figure 2. At no point during the period of rising temperatures (the left side of the graph, before temperatures plateau) do small decreases in emissions actually cause an absolute decrease in temperature - and hence would not cause absolute decreases in mortality - and this period will continue until cumulative greenhouse gases in the atmosphere stabilise (i.e. when anthropogenic emissions cease or become equal with the rate of dissipation of carbon from several hundred years ago). Instead, during this period, they simply delay temperature increases slightly. However, once the plateau is reached (most likely not within the next 100 years in the IPCC’s business-as-usual scenarios),47 during which emissions are as low as the rate at which carbon is removed from the atmosphere, that small decrease in present emissions results in a slightly lower peak or plateau. Then, after roughly 500-1000 years, that reduction in present emissions means that temperatures return to a baseline slightly sooner.
Figure 2: Global mean atmospheric temperature over time with and without some small amount of present emissions.
Now, for human mortality, we must begin to make some basic assumptions to allow for a model to be constructed. The first is that the relationship between temperature increase and human mortality is roughly linear. This may not be entirely true to reality, as there may be particular temperature thresholds past which mortality increases quite rapidly (for example, the threshold at which areas at higher elevations become suitable for malaria transmission, potentially resulting in large populations suddenly becoming at risk of infection). However, it can still accurately describe the average increase of mortality, at least across some small given interval. This is useful as it is impossible in practice to establish at what point these sudden increases might occur or, due to uncertainty, where on the scale we will be in several decades and whether some amount of emissions will take us to such a threshold. For simplicity, this is a necessary assumption to make.
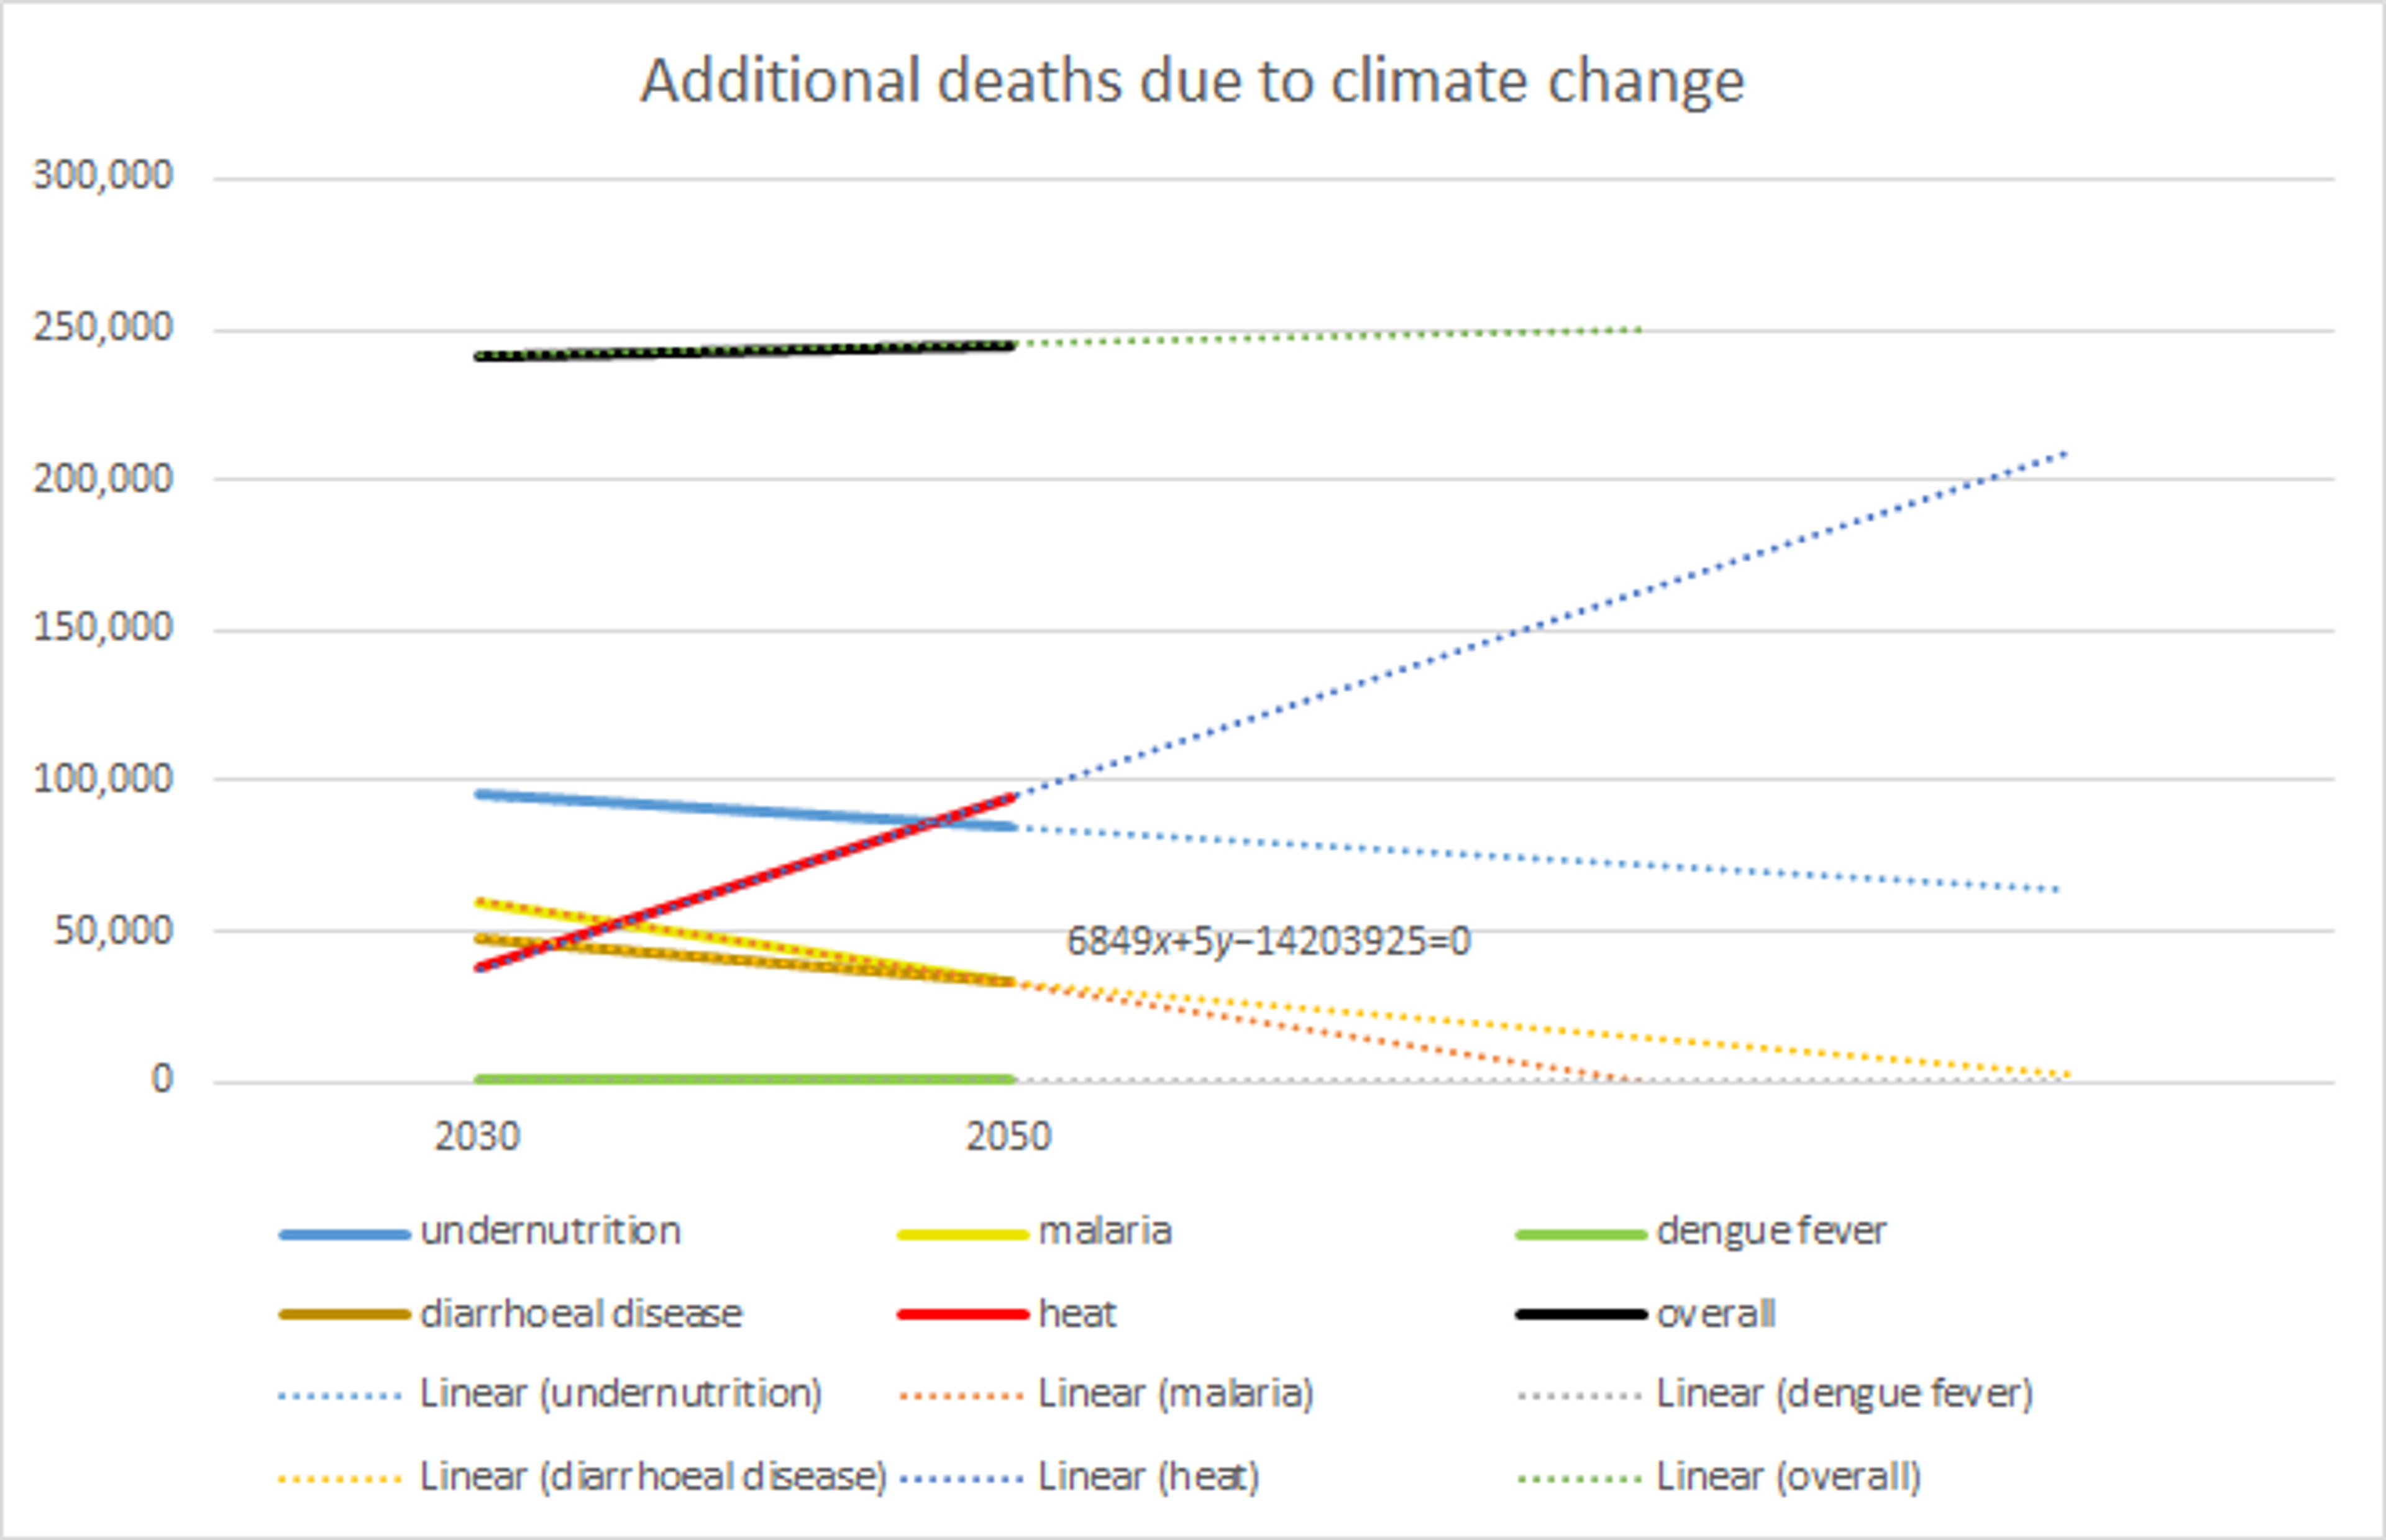
Next, we must somehow determine the timing of the effects on mortality of temperature rises (and hence of emissions). From the WHO report we have estimates of mortality in 2030 and 2050 and, from the IPCC report, we know that temperature rise is predicted to be roughly linear between 2030 and 2100 (and, importantly, between 2000 and 2050).48 With the majority of warming due to present emissions occurring in that time frame, and with our assumption above, we have some reason to expect mortality to increase or decrease linearly (at least in individual pathways). In any case, we can assume that mortality between 2030 and 2050 and shortly afterwards will follow a linear path (as illustrated in Figure 1 from the previous section, repeated below with trendlines). Following linear trendlines, the soonest that the annual mortality figure of any of the individual pathways reaches 0 is in 2073. In reality, this may actually take longer, as the difficulty of reducing deaths due to malaria and other disease may increase over time as low-hanging fruit are exhausted. Nonetheless, it is a fairly safe assumption that during the period when present emissions will cause additional warming (up to 2066) there will be a roughly linear increase in mortality due to these factors.
Figure 1: Additional deaths due to climate change under BAU, based on mean estimates from WHO’s Quantitative Risk Assessment, with linear trendlines extending to 2073 and beyond.
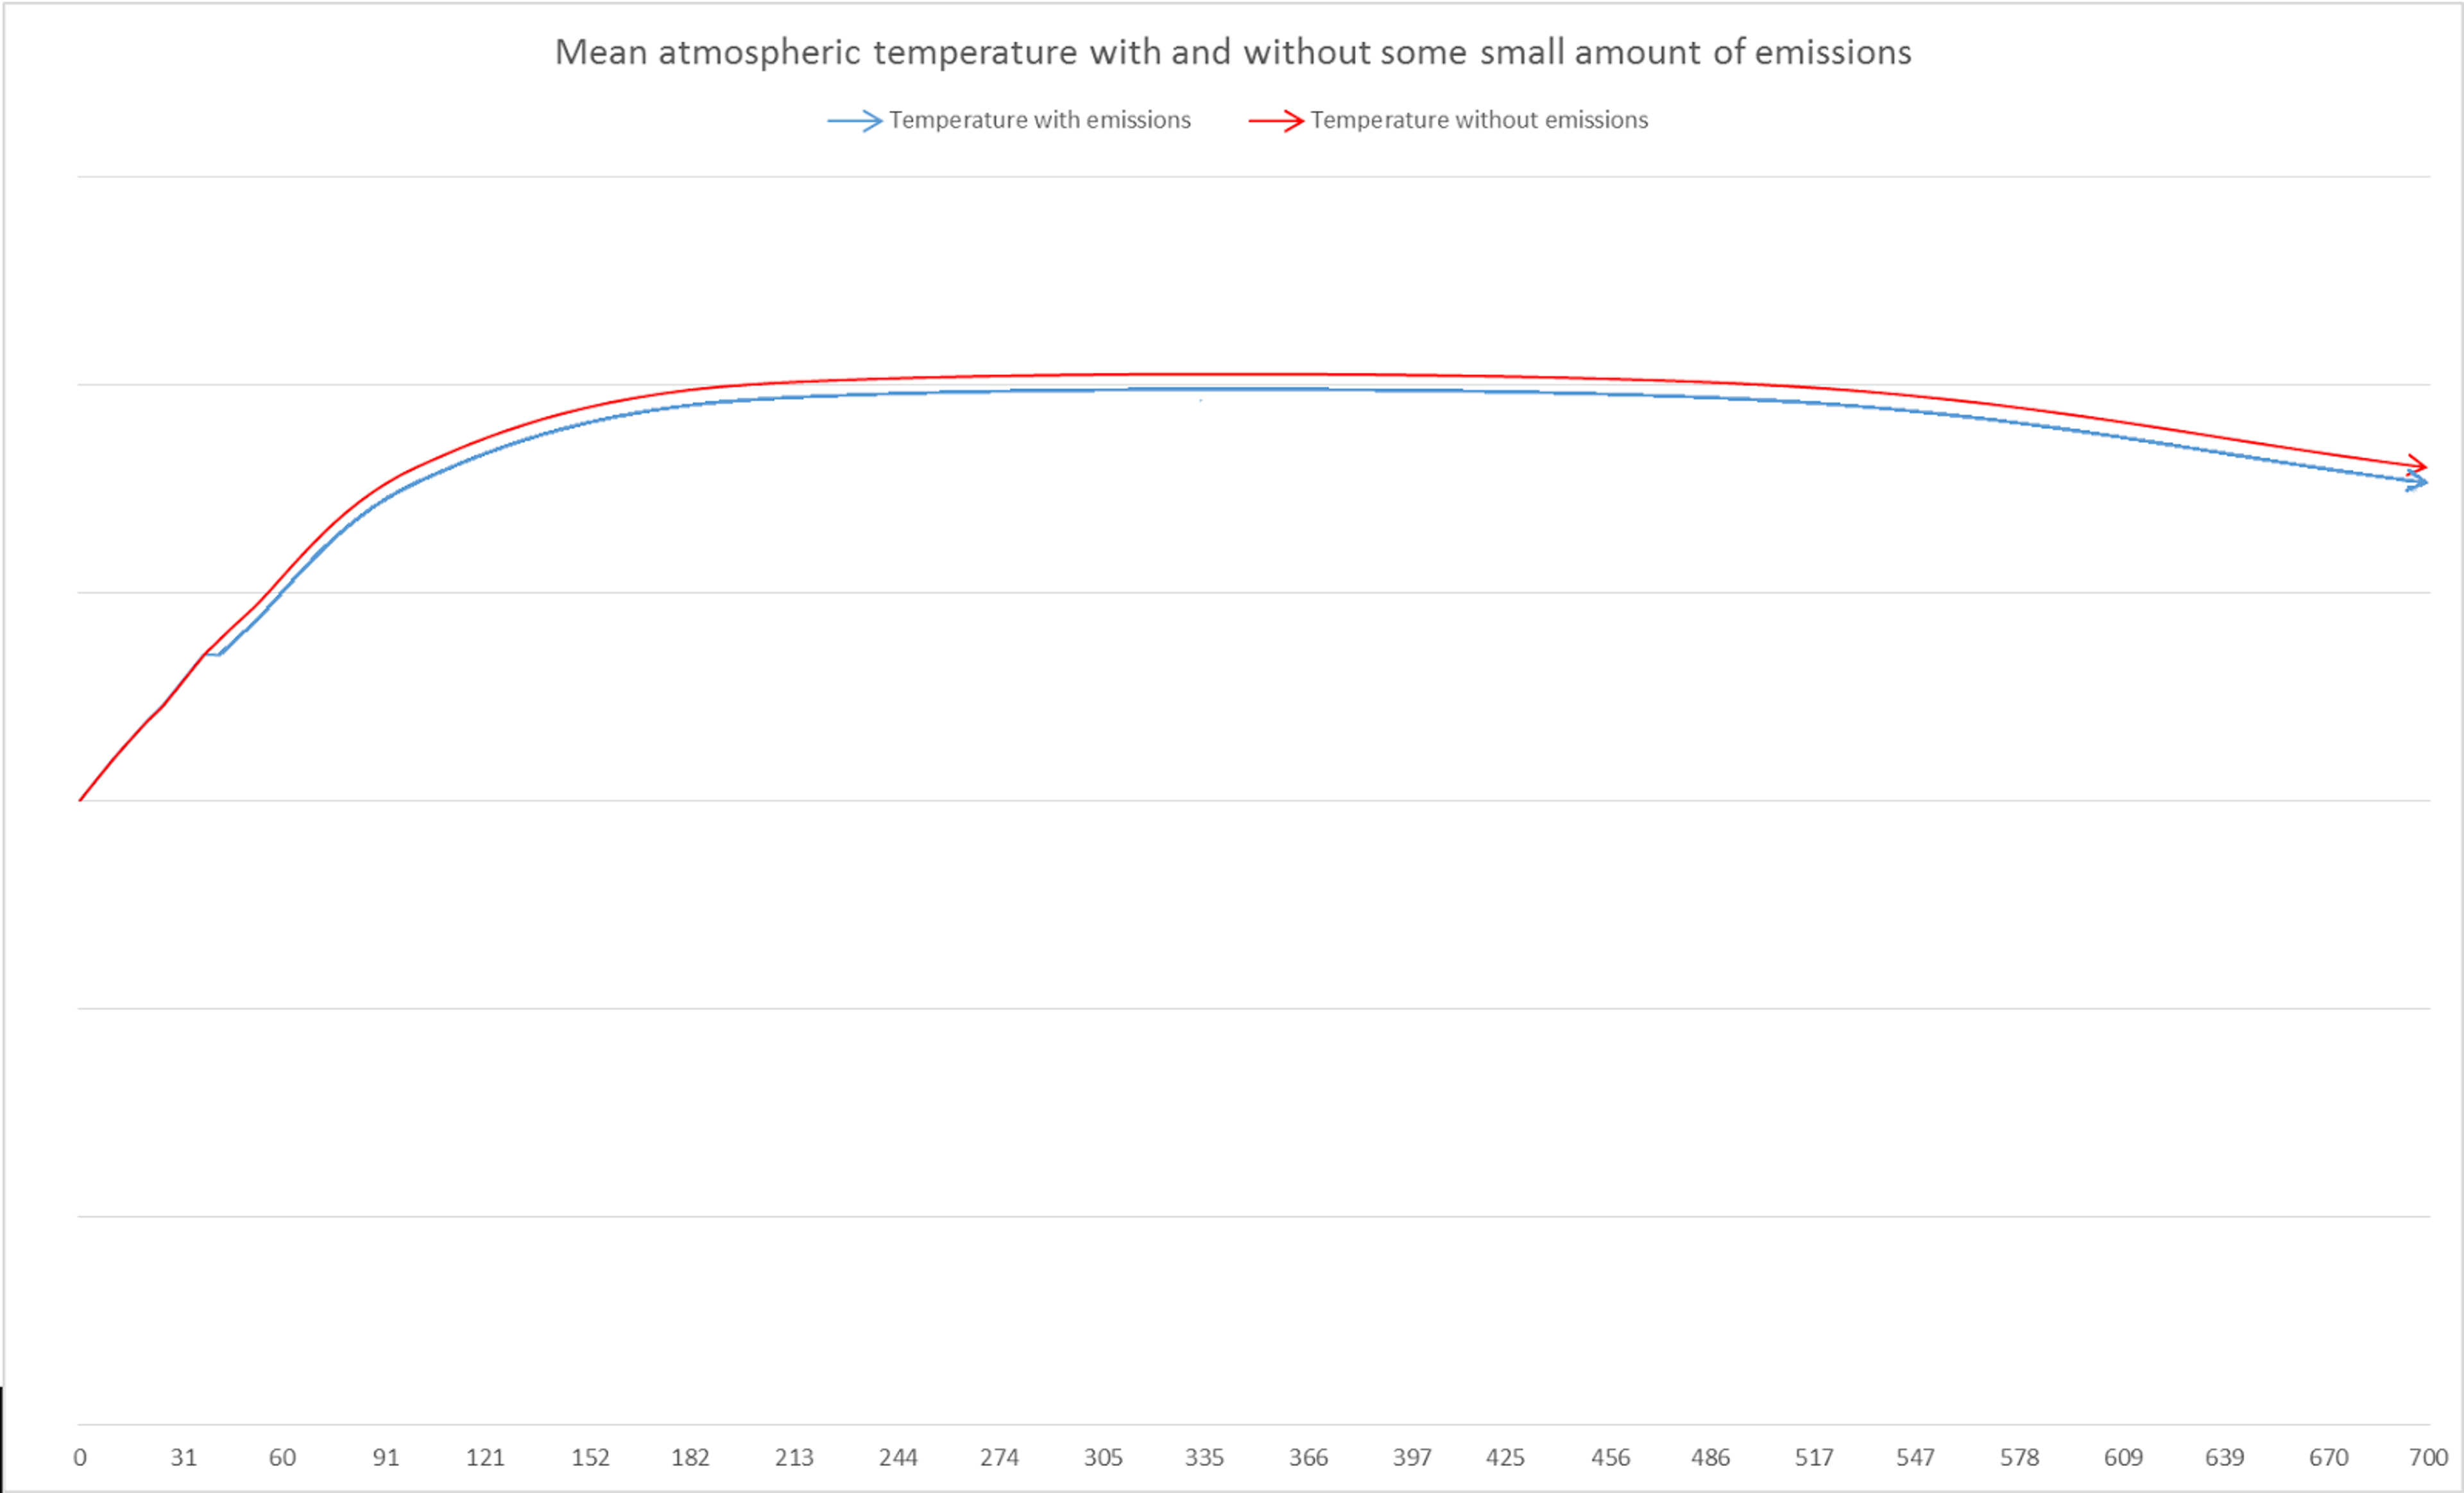
Given this, we can approximate the impact of preventing all anthropogenic emissions in the present year (50GtCO2eq) as delaying the increase of mortality by one year in roughly 37.5 years’ time (although the exact year does not matter so much). Given the linear trend of increasing mortality between 2030 and 2070, exact timing is no longer important for either the warming due to present emissions, or increases in mortality due to temperature increases (these may potentially be delayed as, for instance, malaria may take time to spread). This is so long as neither of these delay the effects beyond 2070, which is reasonably unlikely as it allows for a 16 year delay after the 37.5 mark. With temperature and mortality both increasing linearly, the spread of warming over multiple years or the delay of health impacts for an extra few years would still result in a 50Gt reduction in present emissions resulting in a delay in increased mortality by one year - for instance, for warming occurring over a wider spread, if 10% of warming from some amount of emissions occurred in an earlier year then the linear relationship between temperature and mortality would result in the total effect being equal to 10% of the BAU mortality increase in that year plus 90% of the mortality increase in the later year. As the increase is the same in both years, and consistently from 2030 to 2070, it would not change the total increase in mortality due to that amount of emissions. Likewise, any spreading of temperature increases between 2030 and 2070 (or any minor delays in effect) would result in the same total which, for an entire year’s worth of emissions, is equal to annual increase in mortality (which is constant from 2030 to 2070, by our assumptions). For the purposes of modelling, then, we can picture the warming with and without some small present reduction in emissions as below in Figure 3 (as against the more gradual separation of the curves in Figure 1 above).
Figure 3: Global mean atmospheric temperature over time with and without some small amount of present emissions, if warming effects were concentrated in a single year (37.5 years after initial emission).
One proviso for this equivalence is that this spreading and these delays can only be ignored if discounting is not applied. If a discount rate of 3% per year is applied to the impacts of emissions on human health, then earlier increases in mortality will become more significant than later increases. In our estimates of cost-effectiveness, then, we will not apply discounting (although in the model we do note the effects of different discount rates on these figures in a very rough sense, which is unlikely to be entirely accurate). This assumption of a 0% discounting rate is extremely generous to mitigation and, as the effects of climate change on human well being are quite far into the future, will improve the estimates of cost-effectiveness a great deal in comparison to estimates which might use higher discount rates such as 3%.
Conversely, however, this approach will not consider the effects of warming at and beyond the plateau depicted in Figures 1 and 3. Under BAU scenarios, this point of peak warming is not likely to happen before 2200 and, if discounting were applied, the discounted effects of slightly reducing mortality would become negligible. For instance, at a 3% discount rate, a death in 200 years would be equivalent to 0.2% of a death today. By this point, adaptation is also likely to greatly reduce the annual mortality figures. For these reasons, most models of the effects of climate change and the Social Cost of Carbon do not consider impacts this far out. Thus, for simplicity and as a matter of convention, we will not consider the effects of increased temperature on mortality at and beyond the peak of warming.
This provides enough information to very roughly estimate the impact of incremental emissions. If we were to reduce emissions in 2016 by 50Gt, the undiscounted effect on human mortality would be to delay the increase in annual mortality by one year - that is, to save as many lives as would have been lost that year if the trend continued unbroken. This may seem unusual, but it is worth noting that the increases to atmospheric temperature caused by carbon emissions remain in place for 500-1000 years (from above) and, given this, mortality would remain as high as the previous year even if no additional warming occurred. From the WHO’s projections, the lowest estimates of mortality happen to increase (by 5,700 deaths per year) and the highest estimates happen to decrease (by 8,100 per year) - likely due to the fact that these estimates were simply the highest figures produced by their models for each year and hence subject to a degree of randomness. Given this, we will use the annual increase given by the mean estimates of 201 per year for our high and low estimates (but apply the high and low percentages of estimated total mortality). This figure is subject to a great deal of uncertainty, due to the variance in total mortality, but is improved somewhat by being the difference between two mean estimates.
Applying the percentages of total mortality discussed in the previous section (generously extrapolating from present mortality), we therefore have the high estimate that averting 50Gt of CO2-equivalent emissions in 2016 would save 3,931 lives in 2054, 201 of which would result from the causal pathways examined by the WHO. This comes with a very high estimate (effectively an upper bound) of 4,582 lives (see row 28 of the model).
On average, then, the effect of averting one tonne of CO2-equivalent at present would be 1/50,000,000,000 of this, given that cumulative emissions and temperature are roughly linear. Therefore, each tonne of CO2-equivalent averted would save approximately 0.00000215 lives by our high central estimates. Or, using the most generous assumptions and highest estimates, a likely upper bound on the number of lives saved would be 0.00000279. This equates to, by a high central estimate, the result that it would require 464,800t not to be emitted to save one life (with a lower bound of 358,900t). This suggests that if it costs a substantial amount to mitigate a tonne of CO2eq - for example, $1 per tonne - then it would cost, at the very least, $358,900 to save a life through climate change mitigation. This is more than two orders of magnitude than the costs through the top charities recommended by Giving What We Can, such as the Against Malaria Foundation for $2,838.49
However, there is one more consideration which may be built into our calculations - those factors which may put downward pressure on additional annual mortality due to climate change - for instance, adaptation efforts such as disease eradication and prevention (including those conducted by the Against Malaria Foundation,50 Living Goods51 and Development Media International52), or improvements in infrastructure and living conditions to reduce heat deaths. Including these factors, delaying a year’s worth of warming by one year would result not only in a halt in increased mortality in some pathways but, in fact, a decrease in mortality in those pathways and an accelerated decrease in mortality in those pathways where decreases are already occurring. We have little information about the quantitative impact of these factors, but we do know the combined effect of these downward pressures and the upward pressure of increased temperature - that is, the annual increase or decrease estimated by the WHO. The annual increase in deaths by each of the pathways considered (negative for those pathways which decrease over time) will be equal to A - B, where A is the additional deaths each year due to climate change and B the additional reduction in deaths due to such adaptation efforts. We do not know the values of A or B with any degree of certainty but can provide very rough overestimates - for instance, that B is equal in magnitude to the annual increases (or decreases) in mortality (or a more central estimate that B is 80% of the magnitude of the annual increase/decrease). This is likely a large overestimate for most pathways as current eradication programs for tropical diseases are relatively neglected.53 Also, if total global mortality all grew at the same rate due to climate change, it seems unlikely that a great deal more resources could be devoted to adaptation across all such areas. Taking such an overestimate, however, the number of lives saved by any particular emission reduction doubles (or increases by a factor of 1.8 by a more central estimate).
From this, we can revise our estimates towards greater cost-effectiveness. Our high central estimate of lives saved by reducing emissions by one tonne rises to 0.00000387 (with upper bound of 0.000000557). That is, to save one life, we would have to reduce emissions by 258,200t (with lower bound of 179,400t).
This is, of course, all highly uncertain. However, it can be treated as a ‘best guess’ of the health impact, given a number of generous assumptions. We are also reasonably confident that it is highly unlikely that the ratio of tonnes of CO2-equivalent averted to human lives saved is less than our lower bound of 179,400t, on the basis of the assumptions made.
Assumptions
Below are the assumptions which we made in building the above model. For each of these, they were made in the interests of simplicity or for generosity, or both - the former because it would be impossible to model the impacts of climate change on human well being with absolute precision and due to constraints of time and resources; and the latter because our main purposes here are to provide a lower bound on the cost of saving a life through climate change mitigation and to examine just how cost effective mitigation might be.
- That mortality in different areas due to climate change will be proportional to current levels of mortality (generosity);
- That the relationship between temperature increase and human mortality is roughly linear (simplicity);
- That annual mortality due to climate change is roughly linear between 2030 and 2050, and until at least 2070 (simplicity);
- That the impact of preventing all anthropogenic emissions in the present year is equivalent to delaying the increase of mortality by one year in roughly 37.5 years’ time (simplicity)
- That no discounting is applied to delayed effects (generosity);
- That no effects beyond 200 years are considered (simplicity, convention); and
- That the downward effects of adaptation on mortality along each pathway are equal to 80% (or 100% for the most generous estimate) of the magnitude of annual increase or decrease in mortality (generosity).
What does this mean for climate charities?
In our 2013 evaluations, we estimated the cost-effectiveness of climate charities based on the old 5000t/DALY figure. Our top three picks were: Cool Earth, which could reduce CO2 emissions for $1.34 per tonne and thereby improve future health at a rate of $6,700/DALY; Sandbag, which could potentially reduce emissions for $0.0014/t through advocacy or $7/t by purchasing carbon credits, and hence improve health at a rate of either $7 or $35,000 per DALY; and SolarAid, which reduced emissions for less than $15/t and hence averted a DALY for $75,000.
Based on our new estimates, we can revise these costs upwards slightly (note that a death prevented is normally equivalent to roughly 30 DALYs averted, but this varies a great deal based on the cause of death). From our model, we can estimate that: reducing emissions for $0.38/t will require, on average, at least $97,300 to save a life; reducing emissions for $0.0014 or $7 will require at least $251 or $1.26 million, respectively; and reducing emissions for $15/t will require at least $2.69 million. From above, these are all very low estimates so, in all likelihood, it would actually cost a great deal more.
In addition, even if we might suppose, very crudely, that emission reduction were able to cancel out the existing effects of climate change entirely, the amount of emission reduction which would have to be achieved would still result in a cost of $13,700 per life saved, which is roughly 5 times more expensive than the most cost-effective health charities.
In comparison, the Against Malaria Foundation saves a life for roughly every $3,461 spent and averts a DALYs for roughly every $95.54 This suggests that donating to mitigation efforts in order to reduce the impact of climate change on human well being is likely to be far less cost-effective than reducing disease prevalence more directly through AMF or similar health charities. Of course, this ignores the impacts of climate change beyond human well being and, if one places sufficient value on biodiversity or preservation of natural environments sufficiently highly, climate change mitigation may still be reasonably cost-effective. Our estimates of lives saved per tonne are also subject to a great deal of uncertainty - we have attempted to make generous assumptions where possible, but it is still possible (although highly unlikely) that the impacts of climate change are far worse, and the impacts of mitigation far greater, than we have described.
We can also adjust our estimates of cost-effectiveness somewhat based on our more recent investigation into climate change charities. For direct mitigation, Cool Earth was again the most cost-effective organisation we found, but its cost-effectiveness improves even further when the wider shielding effects of its operations are considered. This is incorporated into our model and is also discussed in detail in our full evaluation. We estimate that Cool Earth is able to reduce emissions at a rate of $1.34/t through direct protection of forest but, if we include the additional forest which is shielded by protected forest, this drops to $0.38/t. Based on the model, this equates to a cost per life saved of, at the very least, $97,300. Being even more generous, the lower bound on cost per acre of forest protected is 20% less than the median estimate and the amount of CO2 captured in rainforest soil may potentially be up to 15% greater than the median.55 However, even adopting the most generous estimates available, this still results in a cost of $32,700 per life saved. This demonstrates that it is extremely unlikely that direct mitigation efforts are a cost-effective method of improving human welfare. This is especially as, in actuality, very few of the generous assumptions we’ve made are likely to be true - a better estimate of the cost per life saved is considerably higher, at $97,300 per life saved.
So what should we do about climate change?
One option is to donate instead to the Against Malaria Foundation, Project Healthy Children or other charities which work on undernutrition, malaria, diarrhoeal disease, or heat deaths. However, this probably isn’t a satisfactory conclusion.
However, many donors may not be interested only in human well being when it comes to climate change. And it is true that we haven’t considered other major impacts which climate change is likely to bring about, such as biodiversity loss, damage to ecosystems, destruction of the natural environment, and so forth. Many donors may place a great deal of inherent value in these, and so climate change mitigation may still be highly cost-effective. If this is the case, Cool Earth is likely to be one of the best options available.
Also, there may be other options for reducing the impacts of climate change. Governments, in particular, may be able to reduce greenhouse gas emissions at low or net-negative costs (see our full report on climate change), and the votes of individual citizens may have high expected value.56 Also through well-targeted advocacy, some groups may be able to have an effect on policy and bring about major changes. Donations to charities such as Sandbag and the Citizens’ Climate Lobby may potentially result in considerable impacts due to their advocacy work, despite the even greater uncertainty involved in such work (see the full evaluations of these charities for more information).
It is unclear whether this expected impact exceeds that of charities like the Against Malaria Foundation which perform direct health interventions, and whether one chooses to donate to such a charity may be very much dependent on one’s attitude towards risk (as there is a high probability that additional donations will not result in any policy changes). Nonetheless, climate change advocacy is a promising area of intervention and one in which millions of lives might potentially be saved. So too, if opportunities arise for sufficiently cheap mitigation work, this too may provide opportunities to cost-effectively reduce mortality. In both cases, climate change is an area well worth paying attention to for donors interested in opportunities to do as much good as possible.
See also our full report on climate change and our evaluations of Cool Earth, Citizens’ Climate Lobby, Sandbag and SolarAid.
Modelling the other effects of climate change (for other interested researchers)
Of course, many donors care about effects of climate change other than increased human mortality and, in particular, about the low-probability catastrophic risks associated with it. Unfortunately, I have not been able to factor these considerations in this investigation. The primary reasons for this are the lack of suitable data and the complexity of considering such diverse impacts.
For instance, we do not have robust quantitative estimates of animal suffering, of species loss nor, indeed, of human health impacts at higher-than-expected levels of warming (nor even a well-supported estimate of the probabilities of these levels of warming). To perform an analysis similar to the above, we need to have projections of these not only in explicit quantitative terms but also extended over time. In addition, if they do not describe the total effect, they also need to be supplemented by some indication of what proportion of the total those effects represent, or at least an upper or lower bound - such as we were able to obtain above from the current global burden of disease. We were unable to obtain sufficient information to deal with other types of impact comprehensively, but this represents an opportunity for a great deal of future research.
Complexity is also a major problem for modelling impacts in this area. As a starting point, it might well be counterproductive to assess impacts across a range of distinct areas and require donors to independently calculate whether their own values direct them towards donating to mitigation efforts. Given that human mortality is quite plausibly one of the impacts that individual donors will most widely care about, from a moral standpoint, considering only human mortality seems to be a reasonably good start. Starting from an impact such as this, with both widely accepted moral importance and comparatively robust data behind it, may better allow us to refine and improve on our methods before applying them more widely. That is, if we are able to first work out any problems with the above approach then we should be much better placed to begin to apply it more widely.
For others interested in looking into the broader impacts of climate change, and analysing the cost-effectiveness of interventions in dealing with those impacts, there is clearly an opportunity for further research. The model, and the approach, used here can easily be repurposed for other categories of impact and to better capture the expected impact of tail risks. All that is needed is a collection of quantitative estimates of the median total impact of climate change in the A1B scenario in that area, preferably with multiple estimates over time. Where I have used human mortality that we have used as an input, these figures could easily be replaced with those of impacts in other areas. Likewise, if better estimates of the probability of catastrophic risks become available, then weighted inputs of mortality could be inputted as well. Following the same process as above, this would make it possible to produce explicit estimates of cost-effectiveness and, despite inevitable uncertainty, allow the comparison of climate change interventions with interventions in various other cause areas.
As it stands, considering only human mortality, climate change interventions do not appear to be highly cost-effective. With further research into other impacts, however, this may no longer be the case. Given the current lack of knowledge, this should make further research into the impacts of climate change a high priority for researchers interested in a wide range of cause areas.[^fn-1]: "Climate change - Giving What We Can." 2013. 11 Apr. 2016 <https://www.givingwhatwecan.org/research/other-causes/climate-change/>