Median GDP per capita: how much does the typical person earn in different countries? A look at Global Inequality
Check out our newer article from 2021 that goes into more detail on this topic.
What does the typical person earn?
A recent study asked people in the US what they thought the global median income was: participants thought it was $20,000 per year - 10 times more than it actually is.1 Respondents who were then told that the true global income distribution is much more unequal, i.e. that the global median income is much lower, supported higher spending on foreign aid and cuts in agricultural trade protections at larger rates. They also made donations to charities abroad that were 55% larger relative to people in the control group.
Whenever I read about a country that I don’t know that much about, GDP per capita statistics are usually the first thing I look up on Wikipedia. Of course, income only gives a limited picture of a country, but I want to get a general sense of the economic well-being of its people. But the mean GDP per capita that one typically sees on Wikipedia can be quite misleading in that respect, because it doesn’t take into account wealth inequality (for a detailed explanation see the Appendix at the end of this post). And, until recently, median GDP per capita were hard to come by. But a few months ago, the Centre for Global Development released median income/consumption estimates of countries around the world.2
This data was very useful for development economists who are interested in how many people live in extreme poverty with under $1,90 a day, but for lay people the problem with the presentation of the data was that it showed daily income/consumption and most people are probably more used to think about yearly income/consumption. This is why I multiplied the values by 365 to get at the median income/consumption per capita per year around the world (I call this median GDP per capita for sake of comparison).
Here’s a table with the values3:
You can see that there’s considerable inequality within countries - in the United States $17,593 is the median income, whereas the mean GDP per capita is $54,629, which is what everyone would earn if you perfectly redistributed all income.
But there’s even greater global inequality in terms of median GDP per capita per year: it ranges from $383 in Madagascar to $21,717 in Norway, with most values at the low end. The global median of these medians is $2,630 and the population weighted average of these median values is $4,114 - these two values might be good approximations of global median per capita4, and in line with older empirical estimates of $2,920 by Gallup5. In comparison, world GDP per capita is $14,971 (PPP) 6 - which is what everyone would earn if you perfectly redistributed all income worldwide.
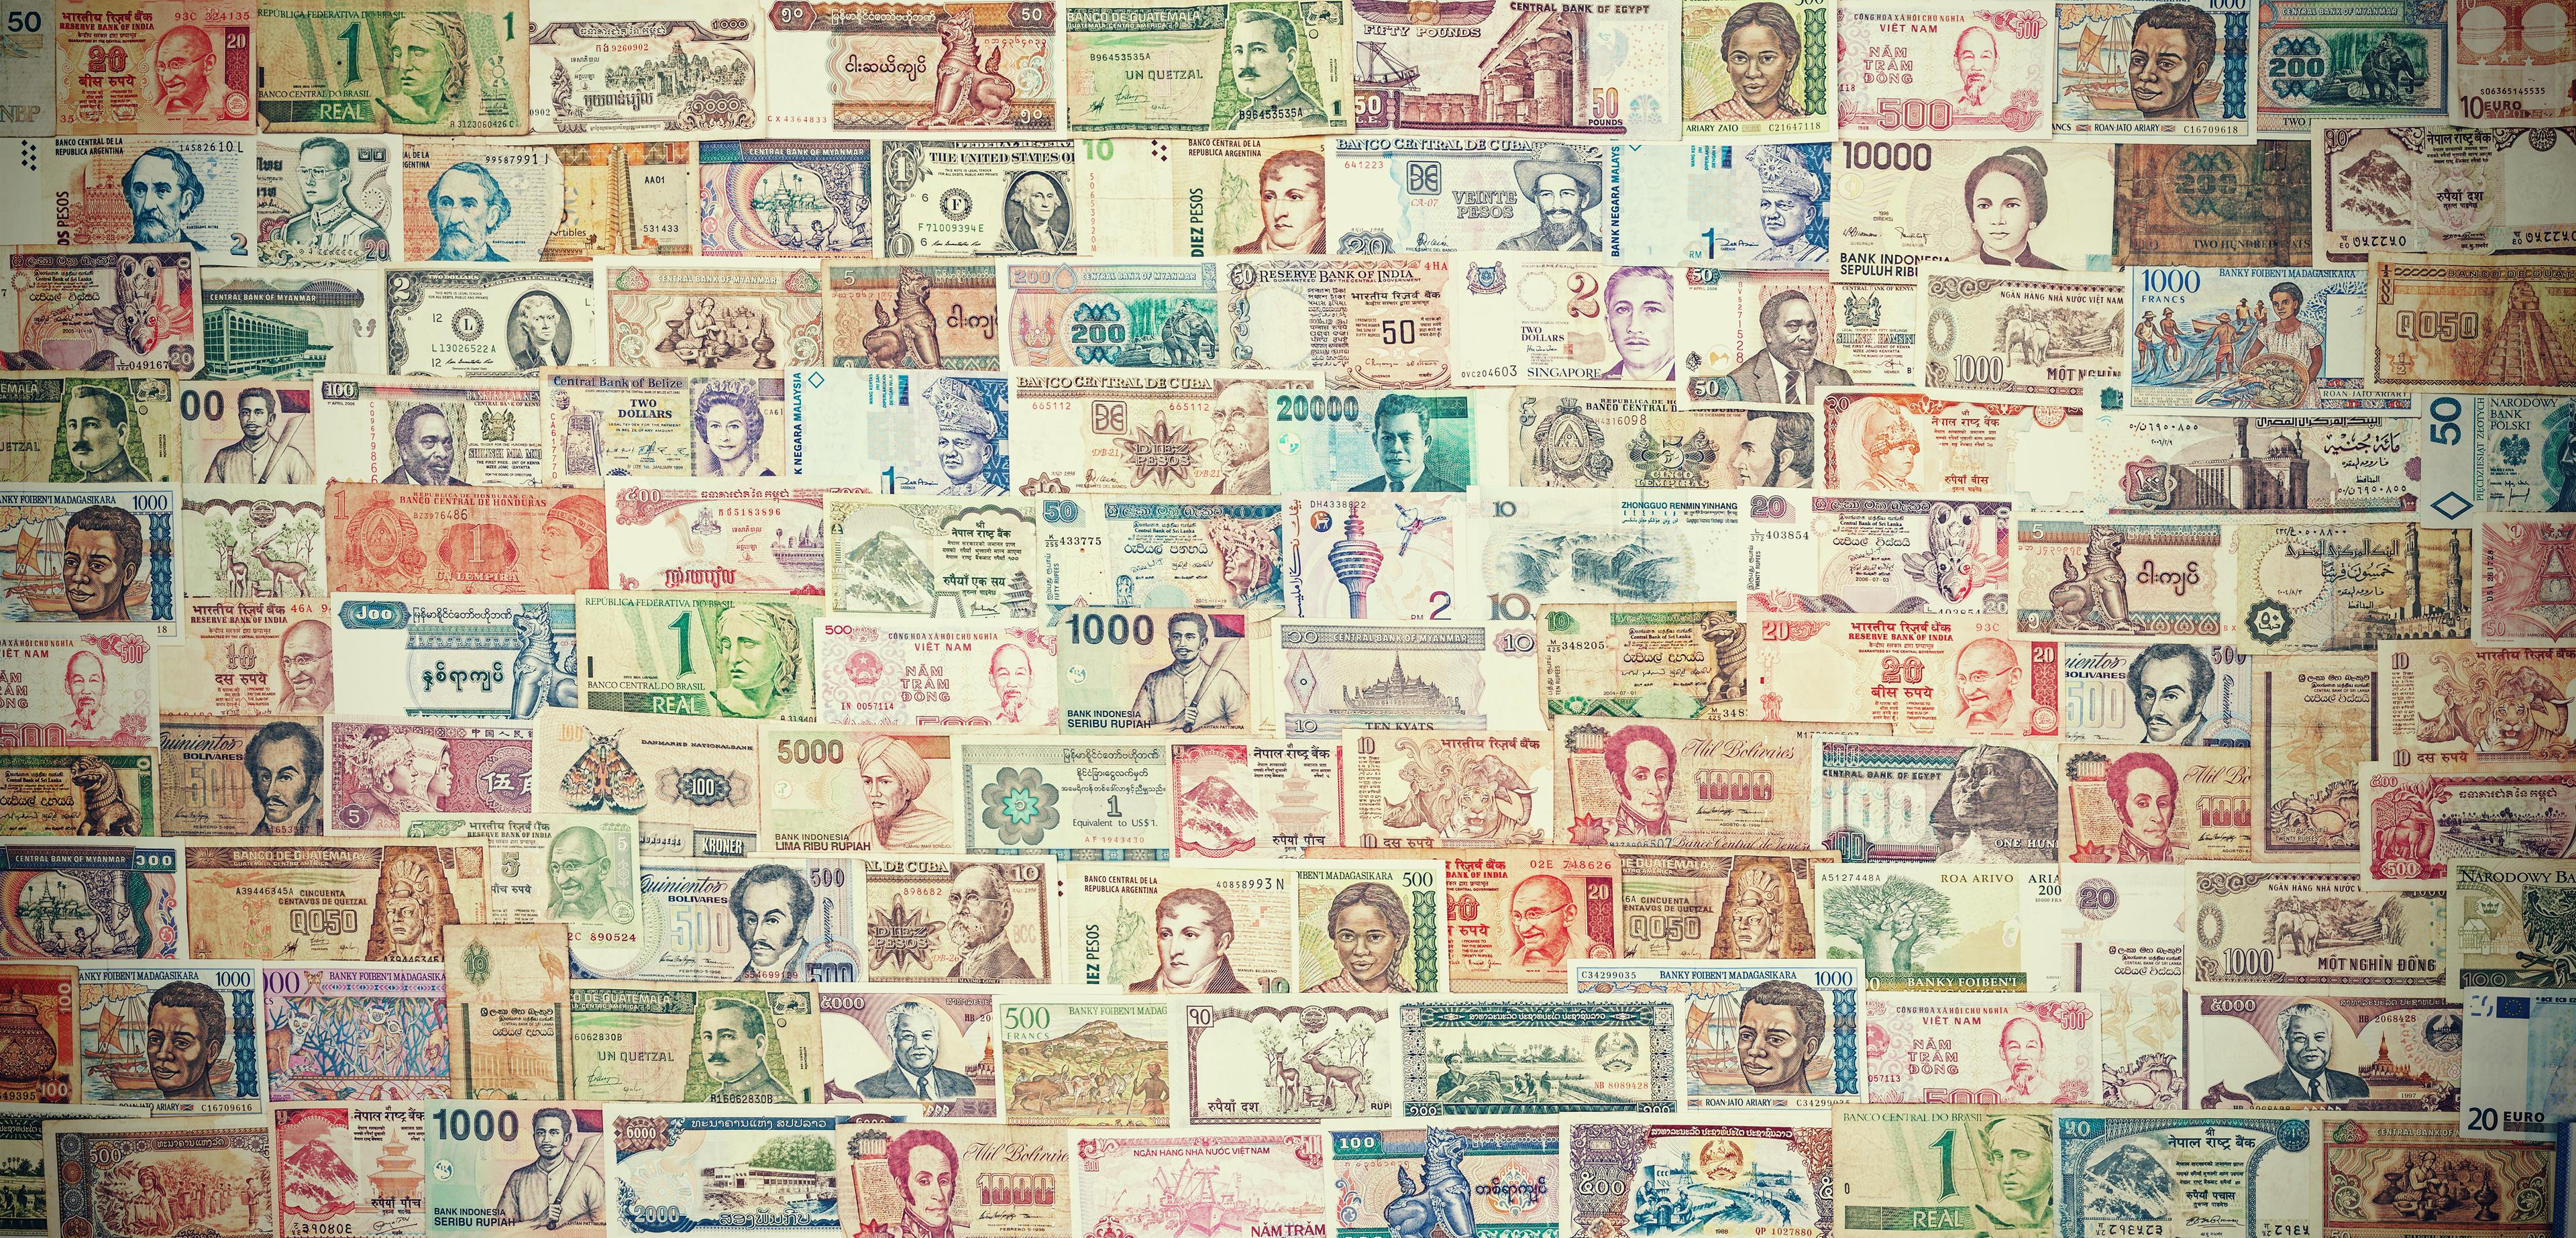
You might notice that that these estimates are already Purchasing Power Parity (PPP) adjusted: this means that this already takes into account, for example, that housing is cheaper in Madagascar than in the United States, and that the government provides more services in the US. It also already includes goods people produce for themselves in the Madagascar (such as growing food or making baskets).7 In other words, when you read that Madagascar has a median GDP per capita (PPP) of $383 per year, then it is comparable to living on $383 per year in the United States. To get a sense of what this would be like you could go on Amazon.com and see how much rice you could buy for $383.
How your money can buy somebody else more happiness
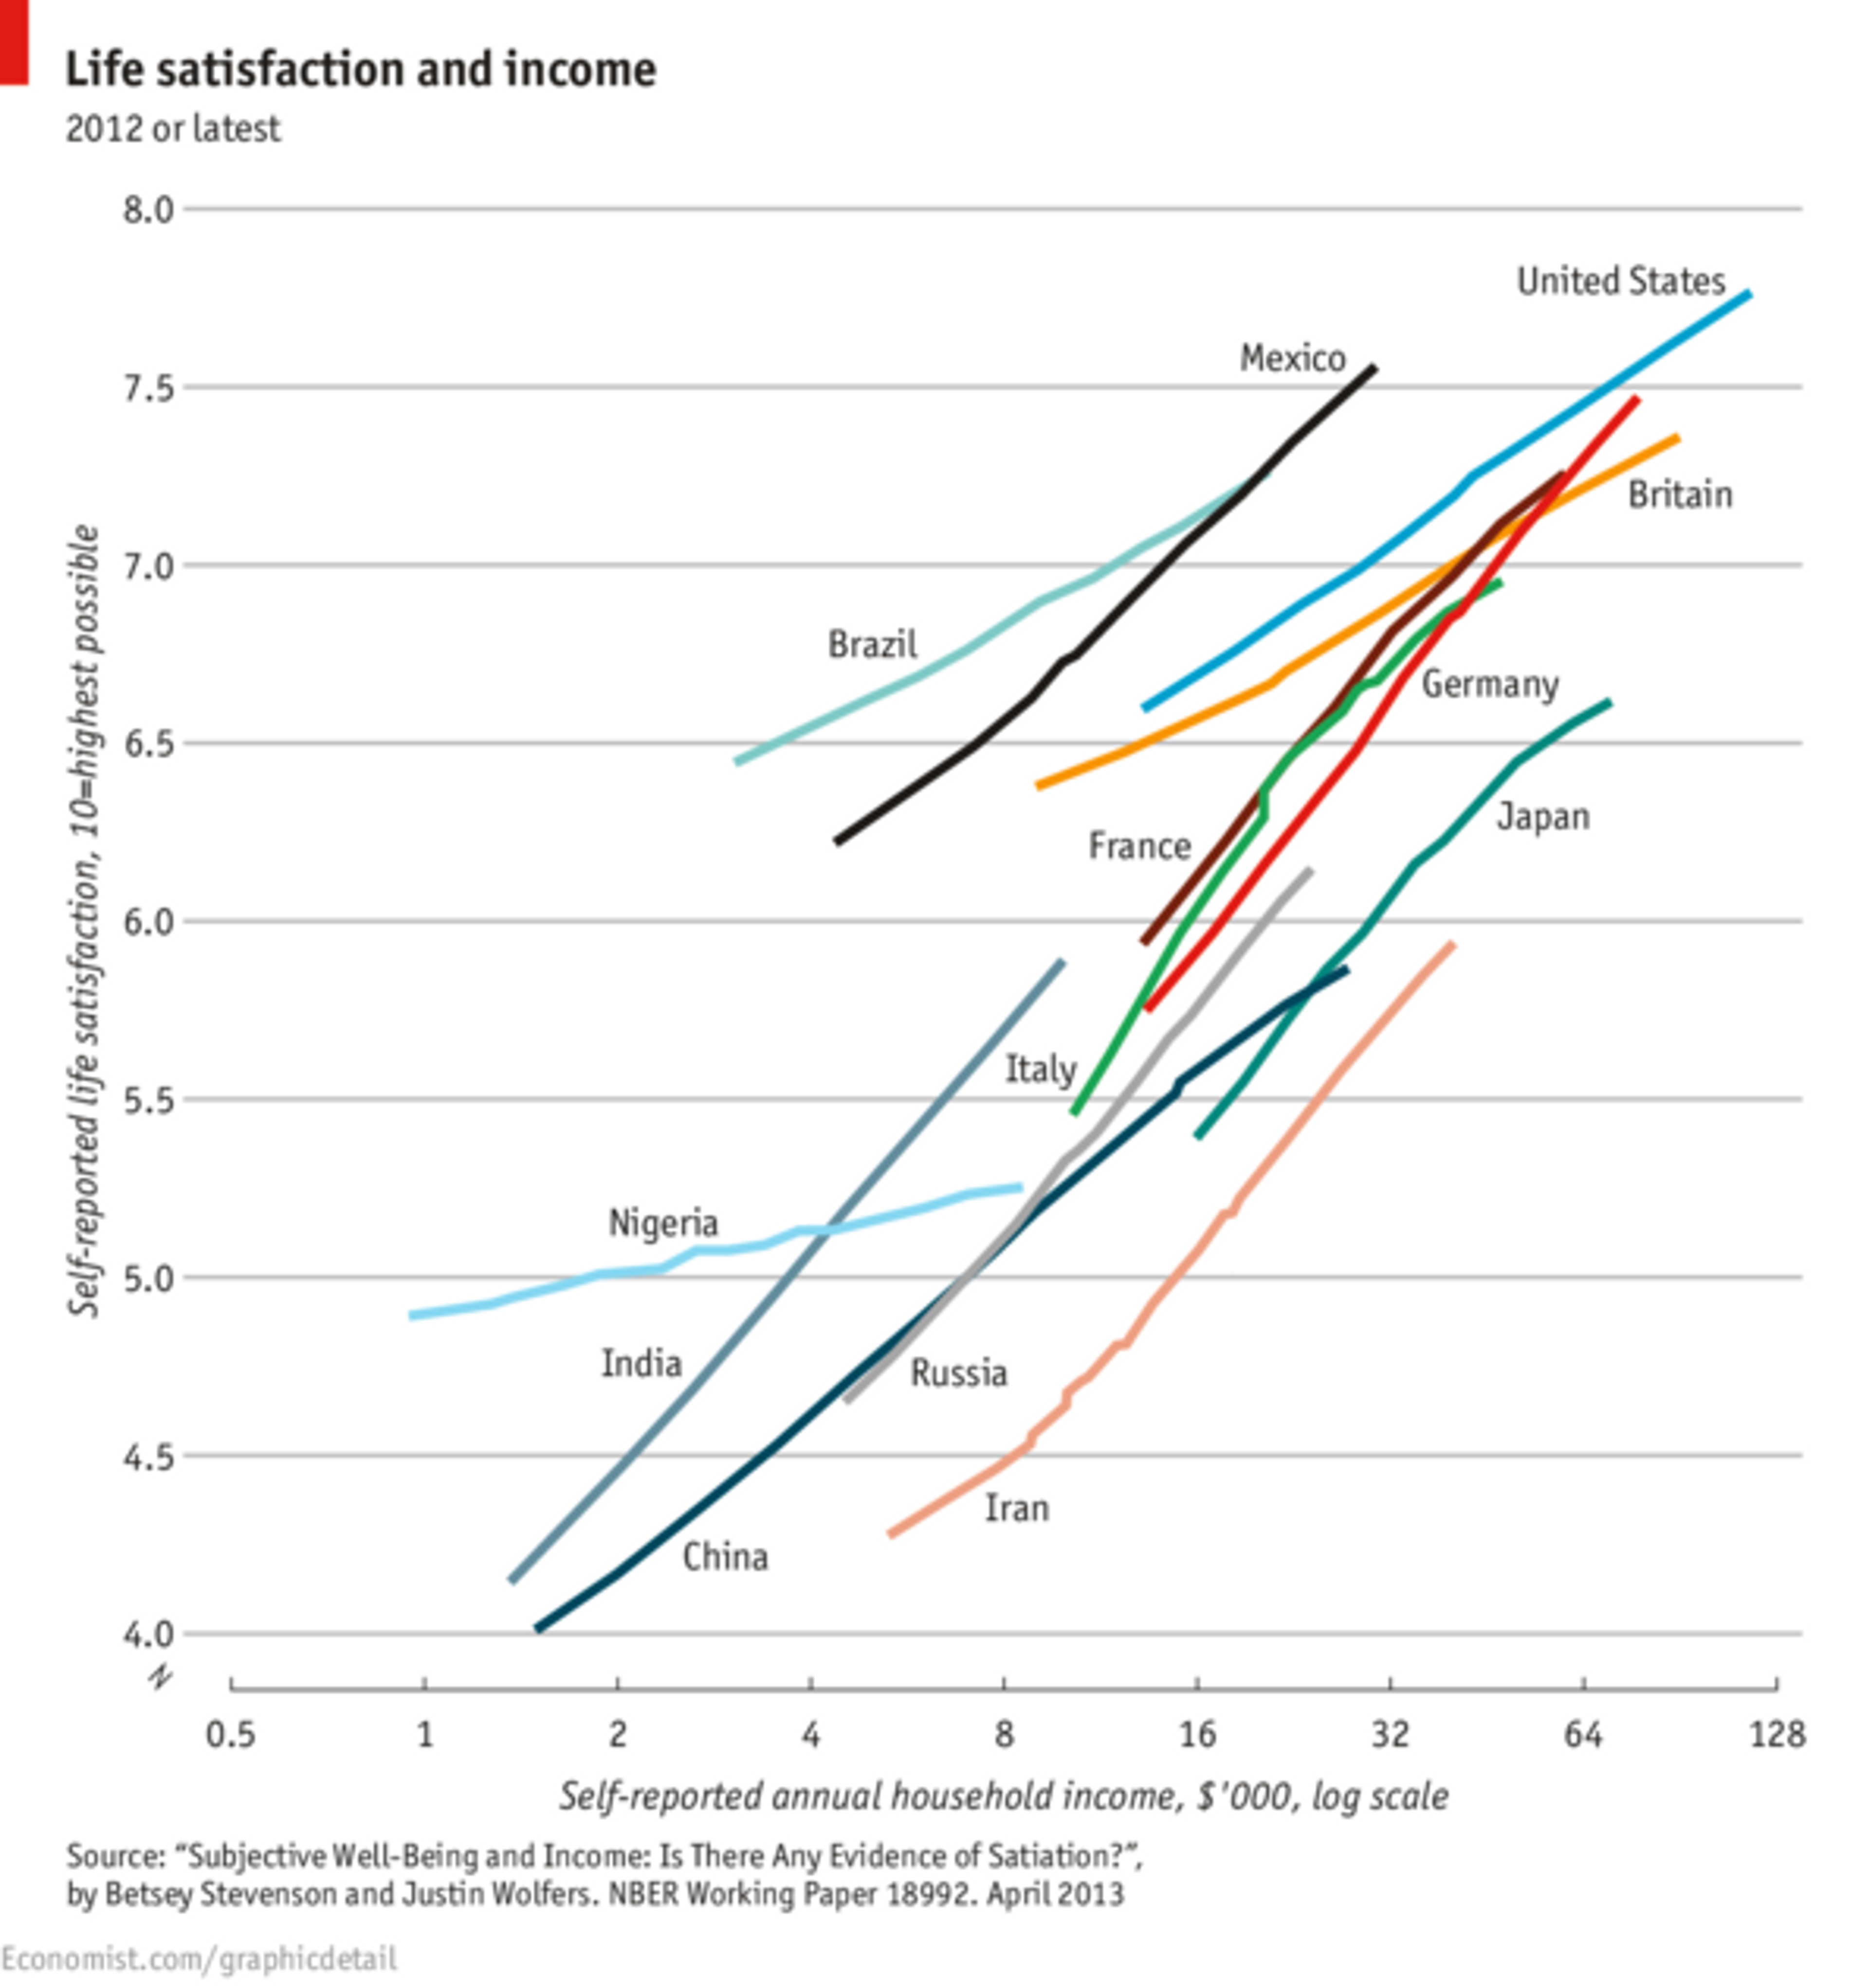
This immense global inequality makes the idea of GiveDirectly so powerful. GiveDirectly is a charity that sends unconditional cash-transfers through mobile phone banking to some of the poorest people on the planet. You get the same increase in wellbeing from having your $20,000 developed world salary doubled as someone in extreme poverty living on $383 in Madagascar would get from receiving a cash transfer that would double their income (see figure below).
A recent study calculated that because of this, giving a one dollar to a truly poor individual is worth the same as giving about $66 to a typical American.8 In other words, if you’d earn $60,000 after tax salary and donated $30,000 and thus forgo the doubling of your wellbeing, you could effectively double the well-being of over 300 people in Madagascar ($30,000/$383 * 4 (adjusting for PPP))! And cash-transfers are considered to be baseline for how much good you can do: Givewell estimates that our recommended charities the Against Malaria Foundation, the Schistosomiasis Control Initiative and the Deworm the World Initiative, are about 10 times more effective than cash transfers, because there is evidence that healthier children earn more later in life9. This means we have an incredible opportunity to do good in the world.
Two-thirds of the variation of how much you earn globally is determined by where in world you were born**[10]****.** When you add how much your parents earn to this, 80 percent of the variance of how much money you earn is explained by things that are clearly beyond your control.10 Such injustice violates our moral intuitions that there ought to be equality of opportunity. You can check out how lucky you are in global terms with our ‘How rich am I? Calculator’..
Appendix: What’s the difference between median and mean GDP per capita?
The average or mean GDP per capita statistics can still be quite misleading, as it doesn’t take into account wealth inequality. Here are two countries fictitious countries to make the point:
| Citizens of Country A | Annual income |
| Alice | $10,000 |
| Bob | $20,000 |
| Carol | $30,000 |
| Mean GDP per capita | $20,000 |
| Citizens of Country B | Annual income |
| Alice | $10,000 |
| Bob | $20,000 |
| Bill Gates | $3,960,000,000 |
| Mean GDP per capita | $1,320,016,6667 |
Notice that wealthy people, like Bill Gates, skew the mean value, so that mean GDP per capita is not very representative of the typical person in a country. It’s better to look at median GDP per capita. To calculate the median or middle value, you just make a list of all citizens in a country by income/consumption and pick the one who is in the middle (in this case Bob). 50% of all people will be richer and 50% will be poorer than the person on the median income/consumption. This usually gives a better sense of what the economic well being of an average person is like. In both our countries, median income is $20,000.[a][b]