Did iodized salt raise the IQ of 50 million Americans by 15 points?
Iodine deficiency disorders are prevalent in many African countries, where they make up a substantial part of the overall disease burden. But iodine deficiency can be treated cheaply by iodizing table salt on an industrial scale.

A recent meta-analysis of randomized controlled trials found that iodine fortified foods are associated with increased urinary iodine concentration among children1. This is particularly important given that iodine seems to be crucial for normal physiological and cognitive growth and development of children2.
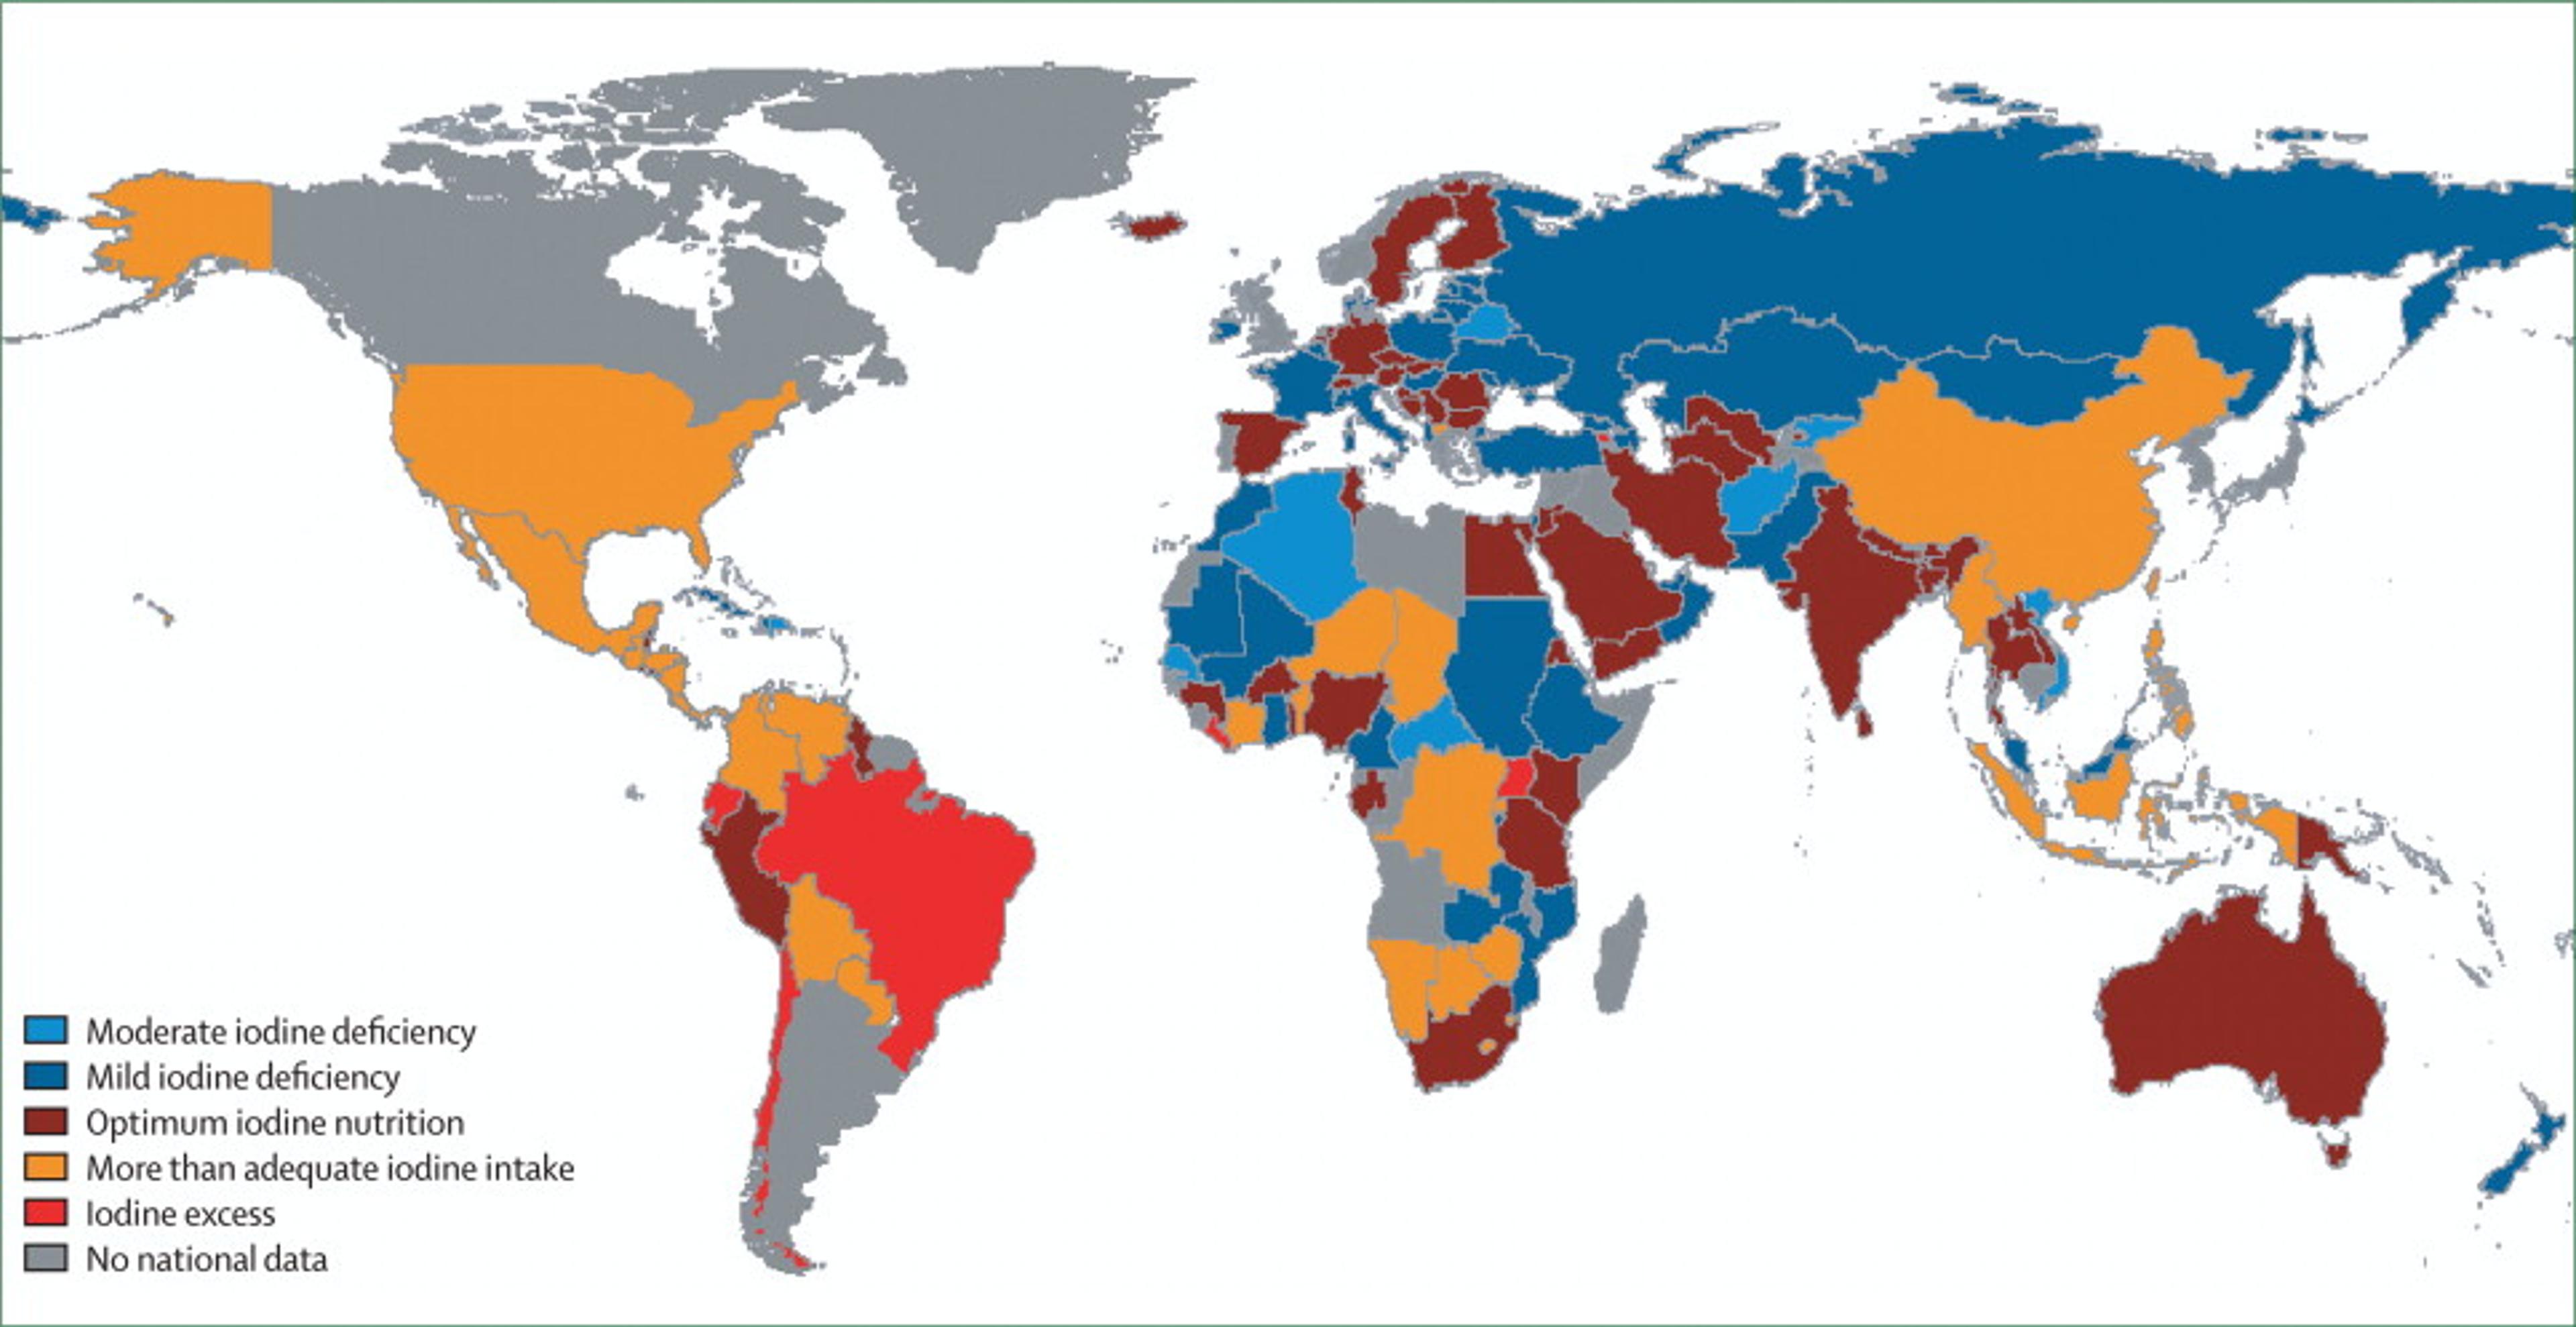
Iodine nutrition based on the median urinary iodine concentration, by country 3
We have in the past reviewed salt iodization and its relationship to mental development in children. We had found a systematic review and meta-analysis that looked at the effects of iodine supplementation on the mental development of young children under 5 4. The authors concluded that evidence from recent studies suggests iodine-deficient children suffer a loss of 6.9-10.2 IQ points as compared with children who are not iodine-deficient. However, the authors caution that some study designs were weak and call for more research on the relation between iodized salt and mental development.
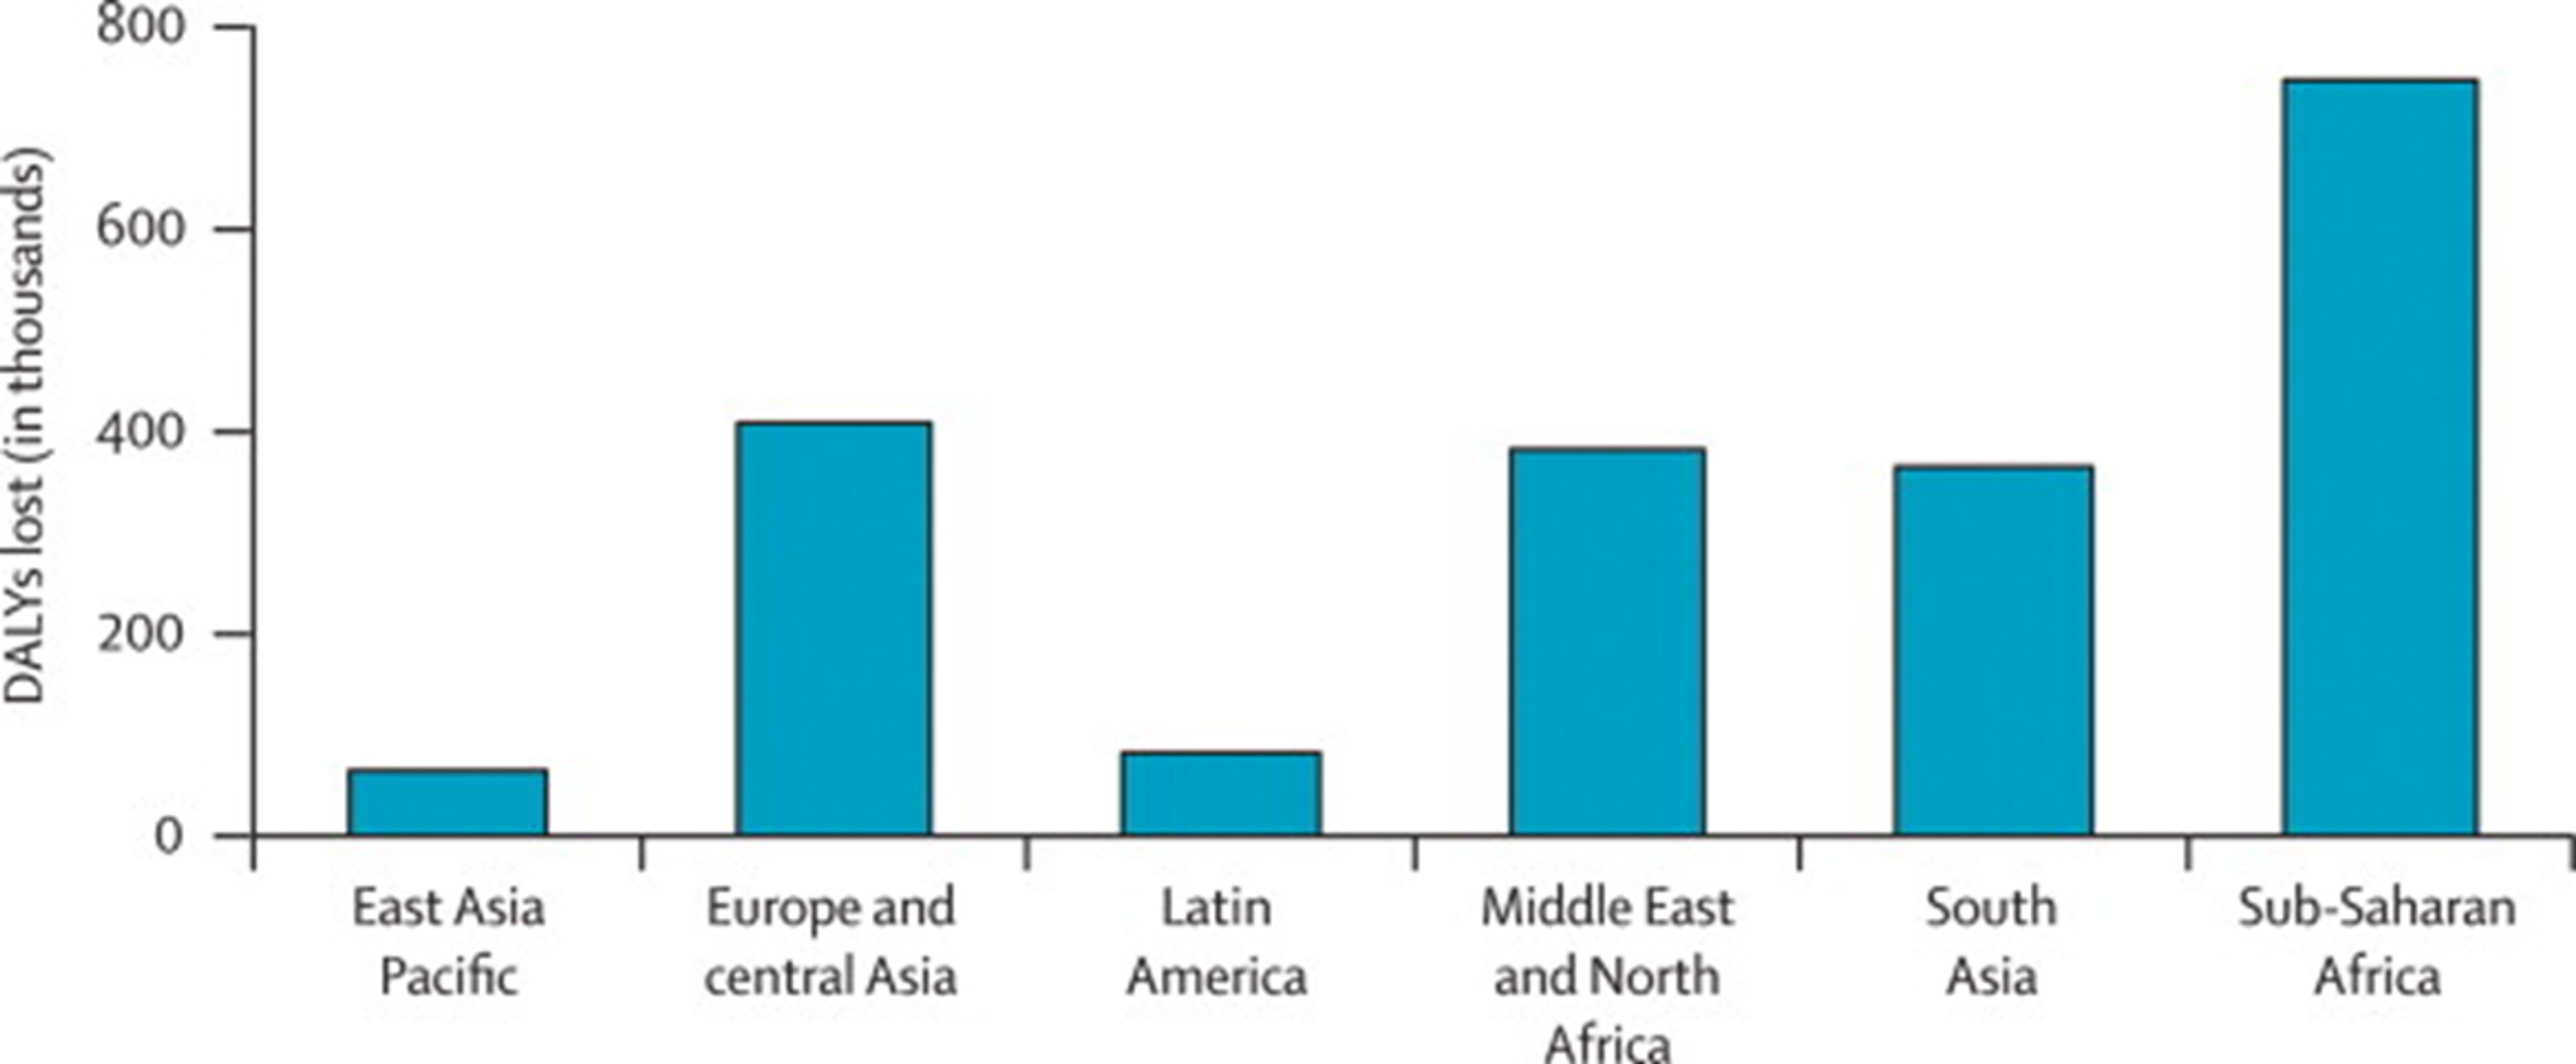
Disability-adjusted life years (DALYs) (thousands) lost due to iodine deficiency in children younger than 5 years of age, by region 3
Now two recent natural experiments provide more evidence that salt iodization might be beneficial for mental development: one study showed that in iodine-deficient regions of the United States in the 1920s, salt iodization raised IQ scores of millions of people by 15 IQ points! 5 The other study suggests that in Switzerland, iodization has improved female labour participation rates. As these studies could substantially update our views on the relative effectiveness of salt iodization programmes - we have reviewed and scrutinized the studies in more detail below.
Introduction
Iodine deficiency, a leading cause of preventable neurodevelopmental disorders, has been largely eliminated in developed countries due to the addition of iodine to table salt, but remains a problem in many developing countries. Iodine is inexpensive and salt is already being consumed being consumed by most people in the world, and so large-scale salt iodisation programmes may be highly cost effective.
Figure 1: Iodine deficiency global map 2014-2015 (Source: Iodine Global Network)
In December 2014, GiveWell published a technical report on salt iodisation. GiveWell investigated “Several small-scale randomized controlled trials (RCTs) [which] examined the effect of iodine supplementation of children on their mental function”, and estimated the effect size to be 0.24 standard deviations, or about 4 IQ points increase due to iodine supplements. In these trials, iodised products were given directly to the families. Therefore, GiveWell also separately looked at the track record of large-scale salt iodization in order to determine whether such programmes really do increase iodine intake, and concluded “We believe there is a reasonably strong case that countrywide salt iodization efforts have successfully reduced iodine deficiency”.
Some new evidence about salt iodisation has not been considered so far. Two recent papers, Weil et al. (2013)5 and Politi (2010)6, look at the effects of the large-scale introduction of iodised salt in the 1920s in the United States and Switzerland, respectively. They consider the impact of salt iodisation during pregnancy on cognitive performance later in life. The headline claim of these studies is that salt iodisation had large effects on cognitive outcomes: iodisation increased the IQ of iodine deficient people by 15 IQ points in the United States, and accounts for roughly 10% of a 20-year increase in school graduation rates in Switzerland. Should we believe these claims?
Is this a question worth asking?
GiveWell lists two iodine charities, IGN and GAIN, and as “standout charities”, and explains that the major unresolved issue with these charities is that GiveWell has “thus far been unable to document a demonstrable track record of impact; we believe it may have had significant impacts but we are unable to be confident in this with what we know now.” Essentially, since these charities assist governments and salt producers in iodising salt, the counterfactual impact (what would have happened if not for the charity?) is very difficult to assess.
It’s reasonable at this point to ask: If we agree that salt iodisation is effective, but we have difficulty finding charities to recommend, then what is the point of looking at other evidence? Can any evidence about the effect size of salt iodisation change our view about which charities we should donate to? The answer is that even if we remain very uncertain about the counterfactual impact of iodine charities, increasing our estimate of the effect size of iodisation increases the expected value of donating to these charities. If we believe that the effect size of iodization on intelligence is larger than previously estimated, then it may become worthwhile to donate to iodisation charities despite the uncertainty. A second reason is that a bigger increase in IQ would warrant additional evaluation of whether iodine charities really do have counterfactual impact.
There are two other reasons why the evidence from Weil and colleagues (2013) and Politi (2010) is interesting to look at. First, these papers primarily look at the effect of salt iodisation during pregnancy, which might be a particularly critical neurodevelopmental period, and not only during childhood. Second, the randomized trials separately examine (i) the evidence for the cognitive benefits of higher iodine intake and (ii) the evidence that large-scale iodisation programmes really lead to higher iodine intake. But the papers discussed in this post sidestep the need for such external validity checks by looking directly at the effects of large-scale iodisation.
What are the claims made by Politi (2010) and Weil et al. (2013)?
These studies are so-called natural experiments. Natural experiments are observational studies that exploit the natural occurrence of quasi-random assignment to a treatment or control group. The advantages of natural experiments are that there is no need to do the costly randomisation oneself, and that they usually have much larger sample sizes and can follow ‘participants’ over long stretches of time. Their main disadvantage is that we can never be certain that the assignment was sufficiently random; the claim of randomness must be carefully checked. Rather than using heuristics such as “only look at true randomisations”, it may be better to carefully check the quality of individual quasi-randomised studies, especially when they claim large effect sizes.
Iodised salt was rapidly introduced in the 1920s in Switzerland and the United States. The level of iodine deficiency varied considerably between geographical regions. We would expect iodine supplementation from salt to have an effect on iodine-deficient regions (treatment) and no effect on iodine-sufficient regions (control). We can measure the effect of iodisation by looking at the difference in differences between deficient and sufficient regions, before and after iodisation. The essential assumption underlying this approach is that the response to iodine is not linear, i.e. that the effect is much larger for people who are iodine deficient than for people who have sufficient iodine. I will now examine the two studies in more detail.
Evaluating Weil et al. (2013): Salt iodisation in the United States
Data sources
In the United States, salt iodization programmes were rapidly rolled out at the beginning of 1924. The authors exploit this by comparing the outcomes of children born before and after 1924, from iodine deficient and iodine sufficient regions. To find out whether iodine had an effect on IQ, they collect data on both iodine levels in different areas before iodization, and data on cognitive abilities of people born before and after 1924.
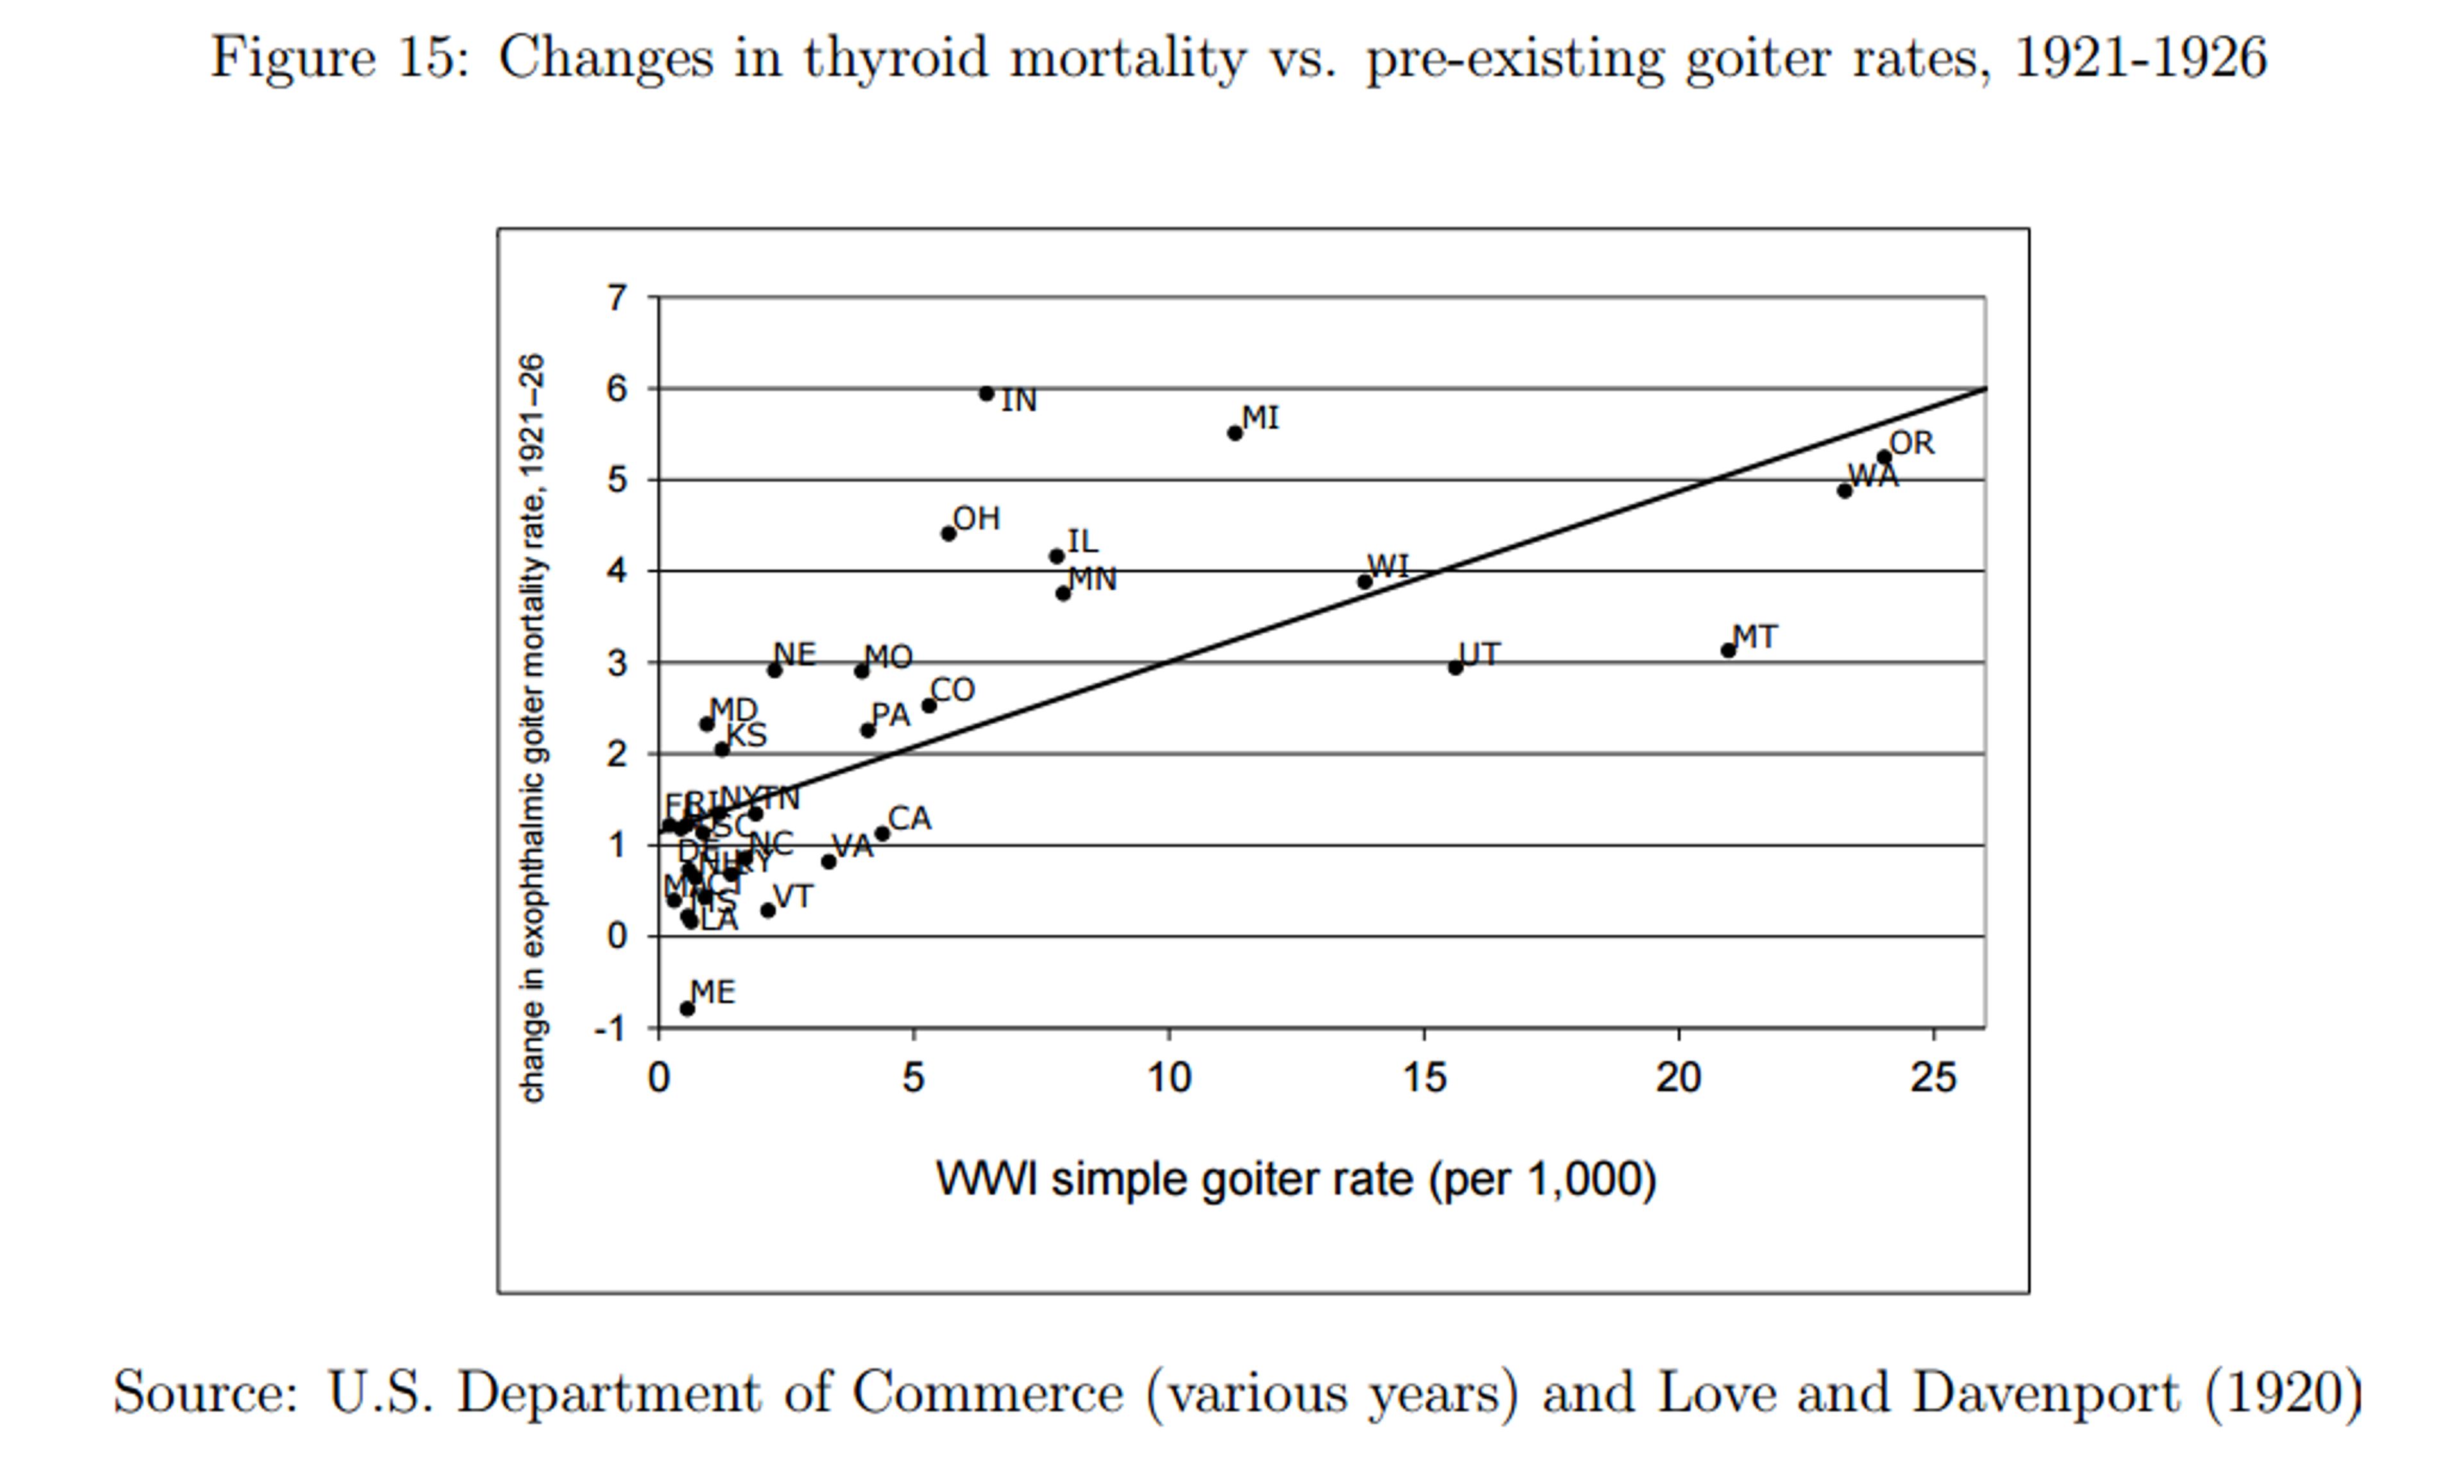
The authors of this paper went to great lengths to infer this information from existing data sets. Understanding their process requires a bit of background information. Goitre is a swelling of the thyroid gland caused by iodine deficiency. During WW1, all draftees were given a medical examination, which included a test for goitre, because an inflated thyroid made soldiers’ necks too big to wear the uniform. In 1920, the war department published Defects Found in Drafted Men (Love and Davenport 1920), which “summarises the results of all the physical exams performed on draftees during World War I for both accepted and rejected men. Data on prevalence rates per 1,000 are recorded for 269 different medical conditions [including goitre]. The data are regional, organized by units called sections. All but the lowest population states are broken down into multiple sections.” Are goitre rates a good proxy for iodine deficiency? To attempt to check this, the authors unearthed a 1924 paper (McClendon 1924) that measured iodine levels in groundwater across 69 US localities, which they then correlated with the goitre rates.
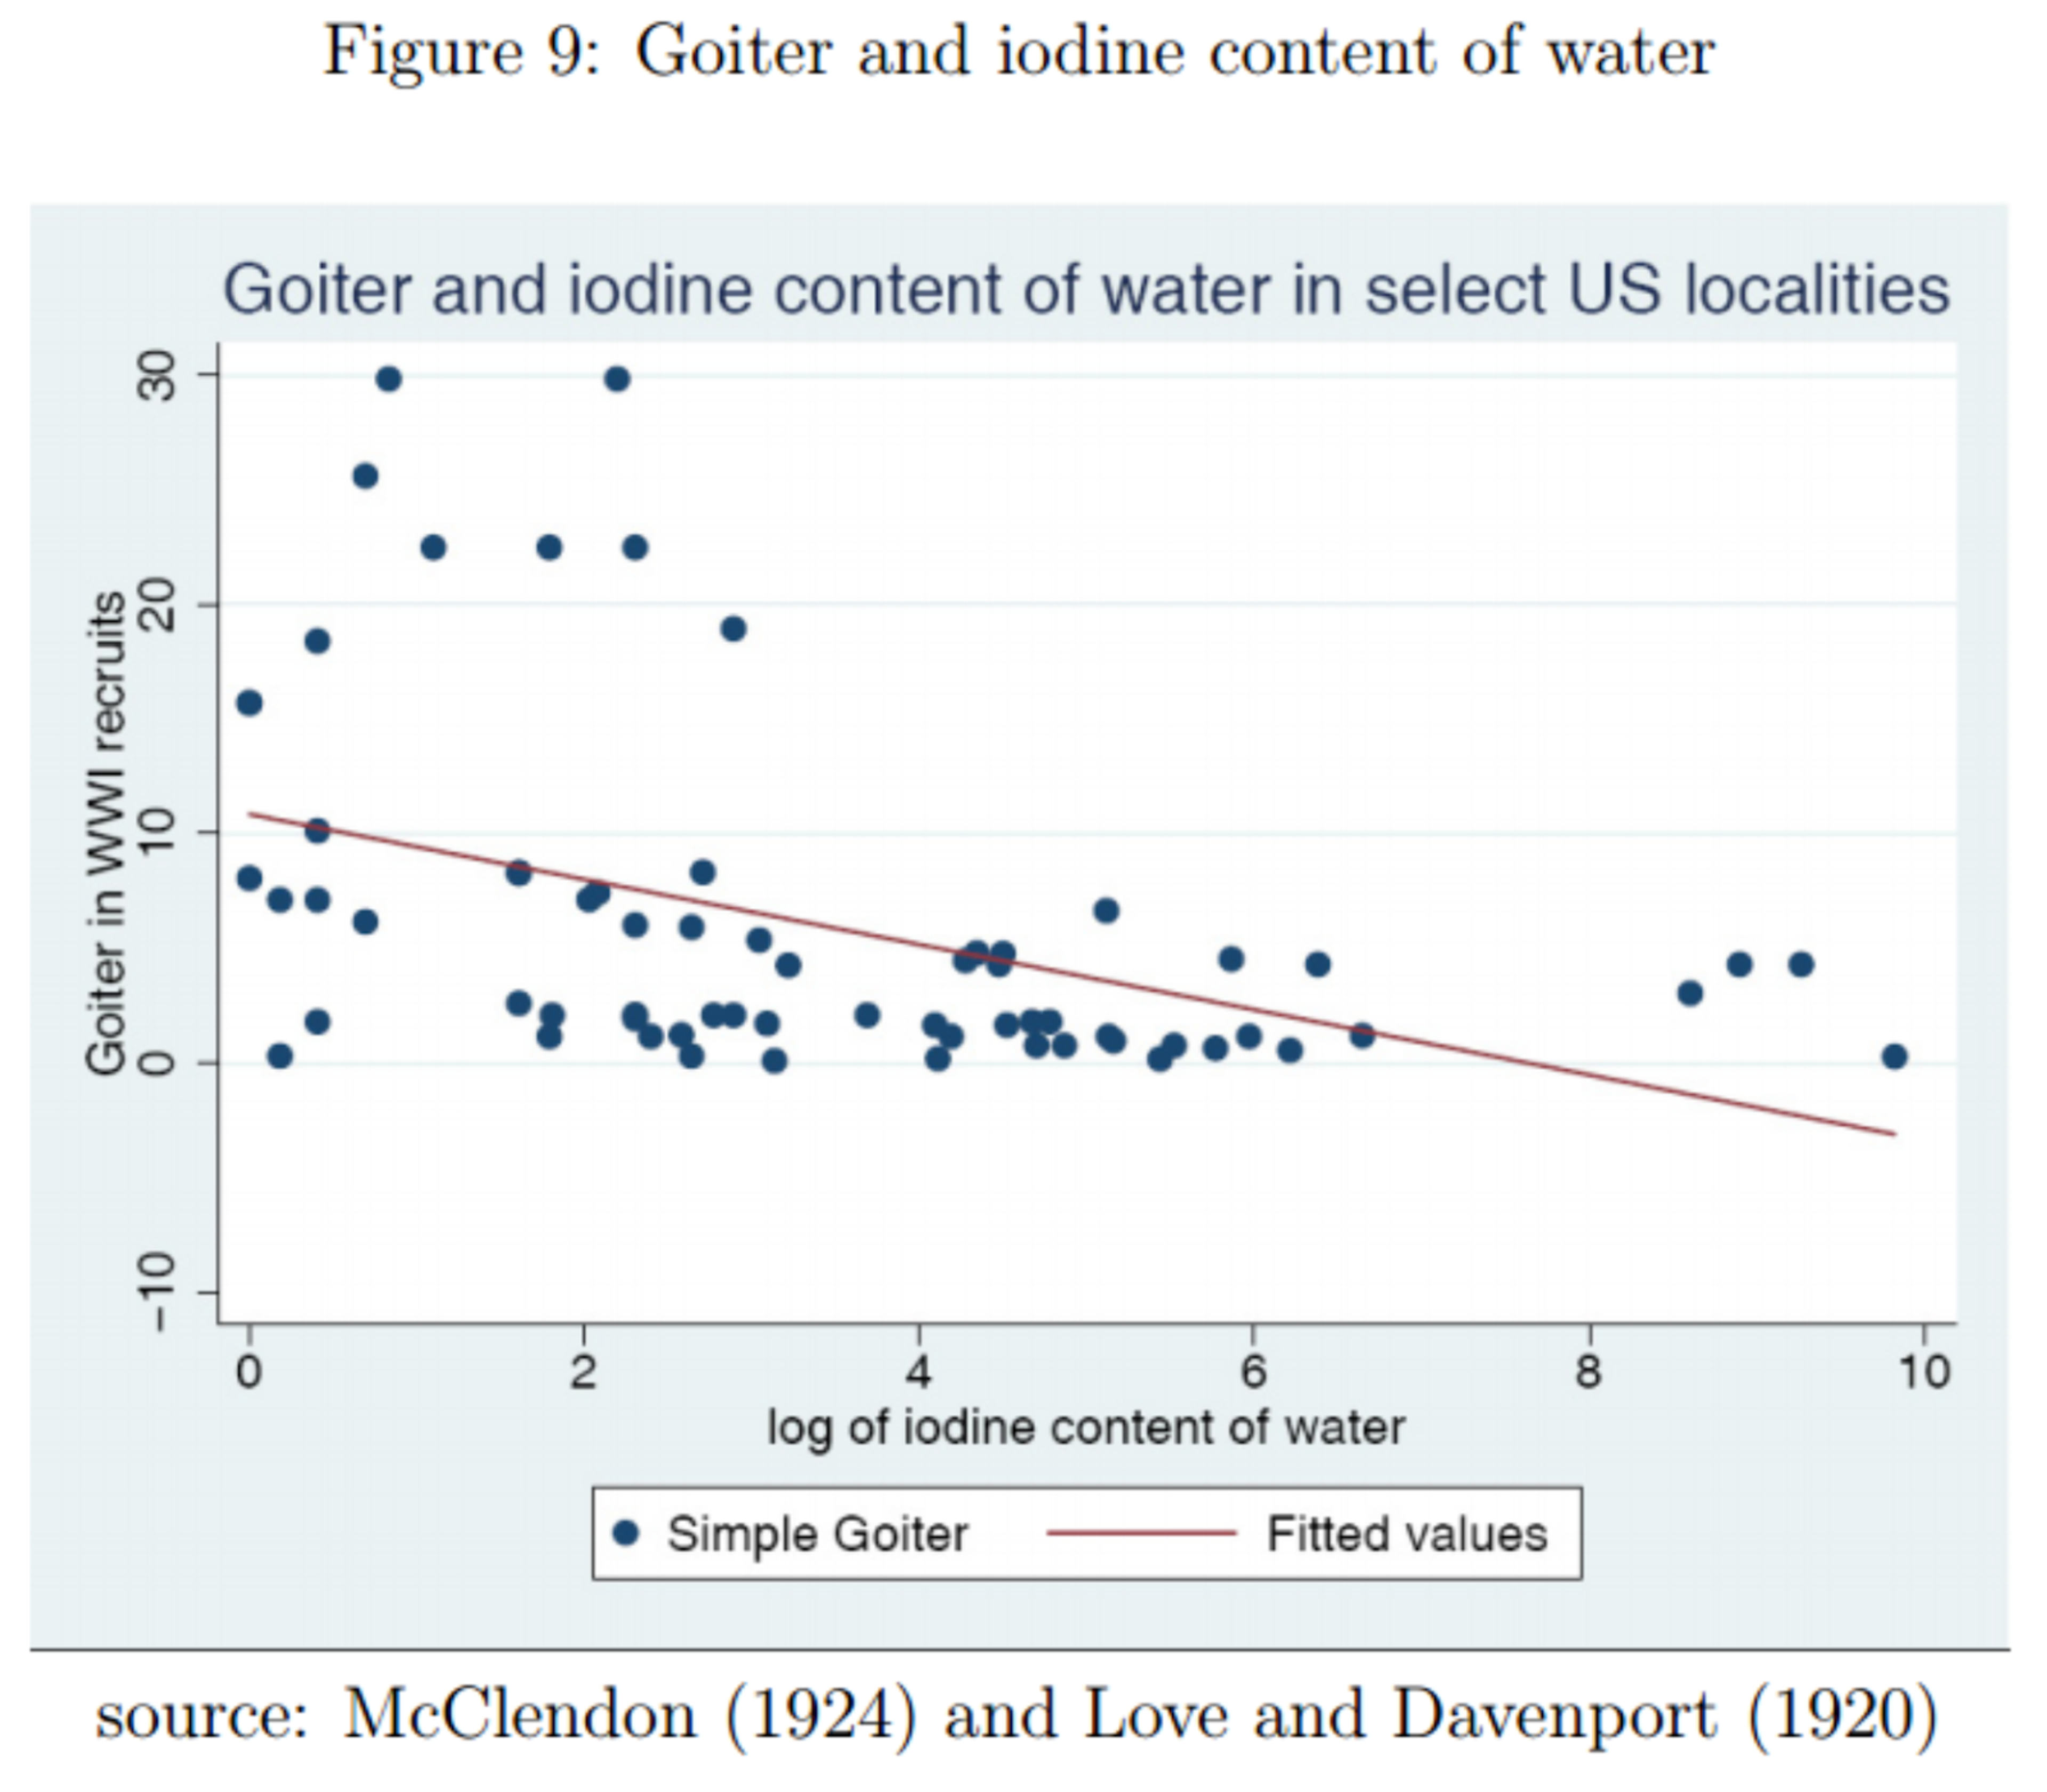
There is a negative correlation, as we would expect. But this correlation seems to be largely driven by about 10 localities in the top left corner. Does this undermine the authors’ argument? I claim that it does not. We are interested in the level of iodine in groundwater only in so far as it is a proxy for total iodine consumption; but there may be other sources of iodine intake in the diet, such as seafood or yogurt7. On the other hand, alternative causes of goitre, such as selenium deficiency or Hashimoto's thyroiditis, are far less common than iodine deficiency8, and goitre has long been recommended by the WHO9 as a measure of iodine deficiency.
How did the authors acquire the second key piece of data, about cognitive abilities of people born around 1924? Men born around this age were drafted when the United States entered World War II (1924+18=1942). All WW2 enlistees were given the Army General Classification Test (AGCT), a close approximation to an IQ test. Unfortunately, test scores were only collected for a short period during the war. However, the authors explain that they are able to make inferences about the test scores by examining which military branch the enlistees were assigned to. There is historical evidence, which the authors discuss at length, that the recruitment policies gave the air force preferential treatment: it received higher-IQ recruits than the ground forces. For most of the war 75% of Air Force recruits had test scores above the mean. In an incredible twist, there happens to be a way to independently verify this. As the authors explain, from March to May 1943, test scores were recorded in the fields marked “weight” for almost all recruits”. Plotting these scores for the air force vs other branches, we get:

Airforce enlistees had scores of 124 rather than 100, 1.2 standard deviations higher than other branches. This provides strong evidence that the probability of being enlisted in the air force is a good proxy for IQ.
Results
Now that we have the data, let’s have a look at the results.

The difference between high and low goitre groups (the distance between the curves) shows an impressive spike for birth years 1925 and 1926. (The absence of an effect for the 1927 cohort and its reversal for 1928 are actually consistent with historical evidence that towards the end of the war, the infantry crisis gave priority to the ground forces over the air force. I did not mention this fact before in order to keep this blog post simple to understand, but the paper includes a detailed discussion of the issue.) To try to quantify the effect more precisely, let’s have a look at the following regression (note by the way the enormous sample size of more than 2 million):
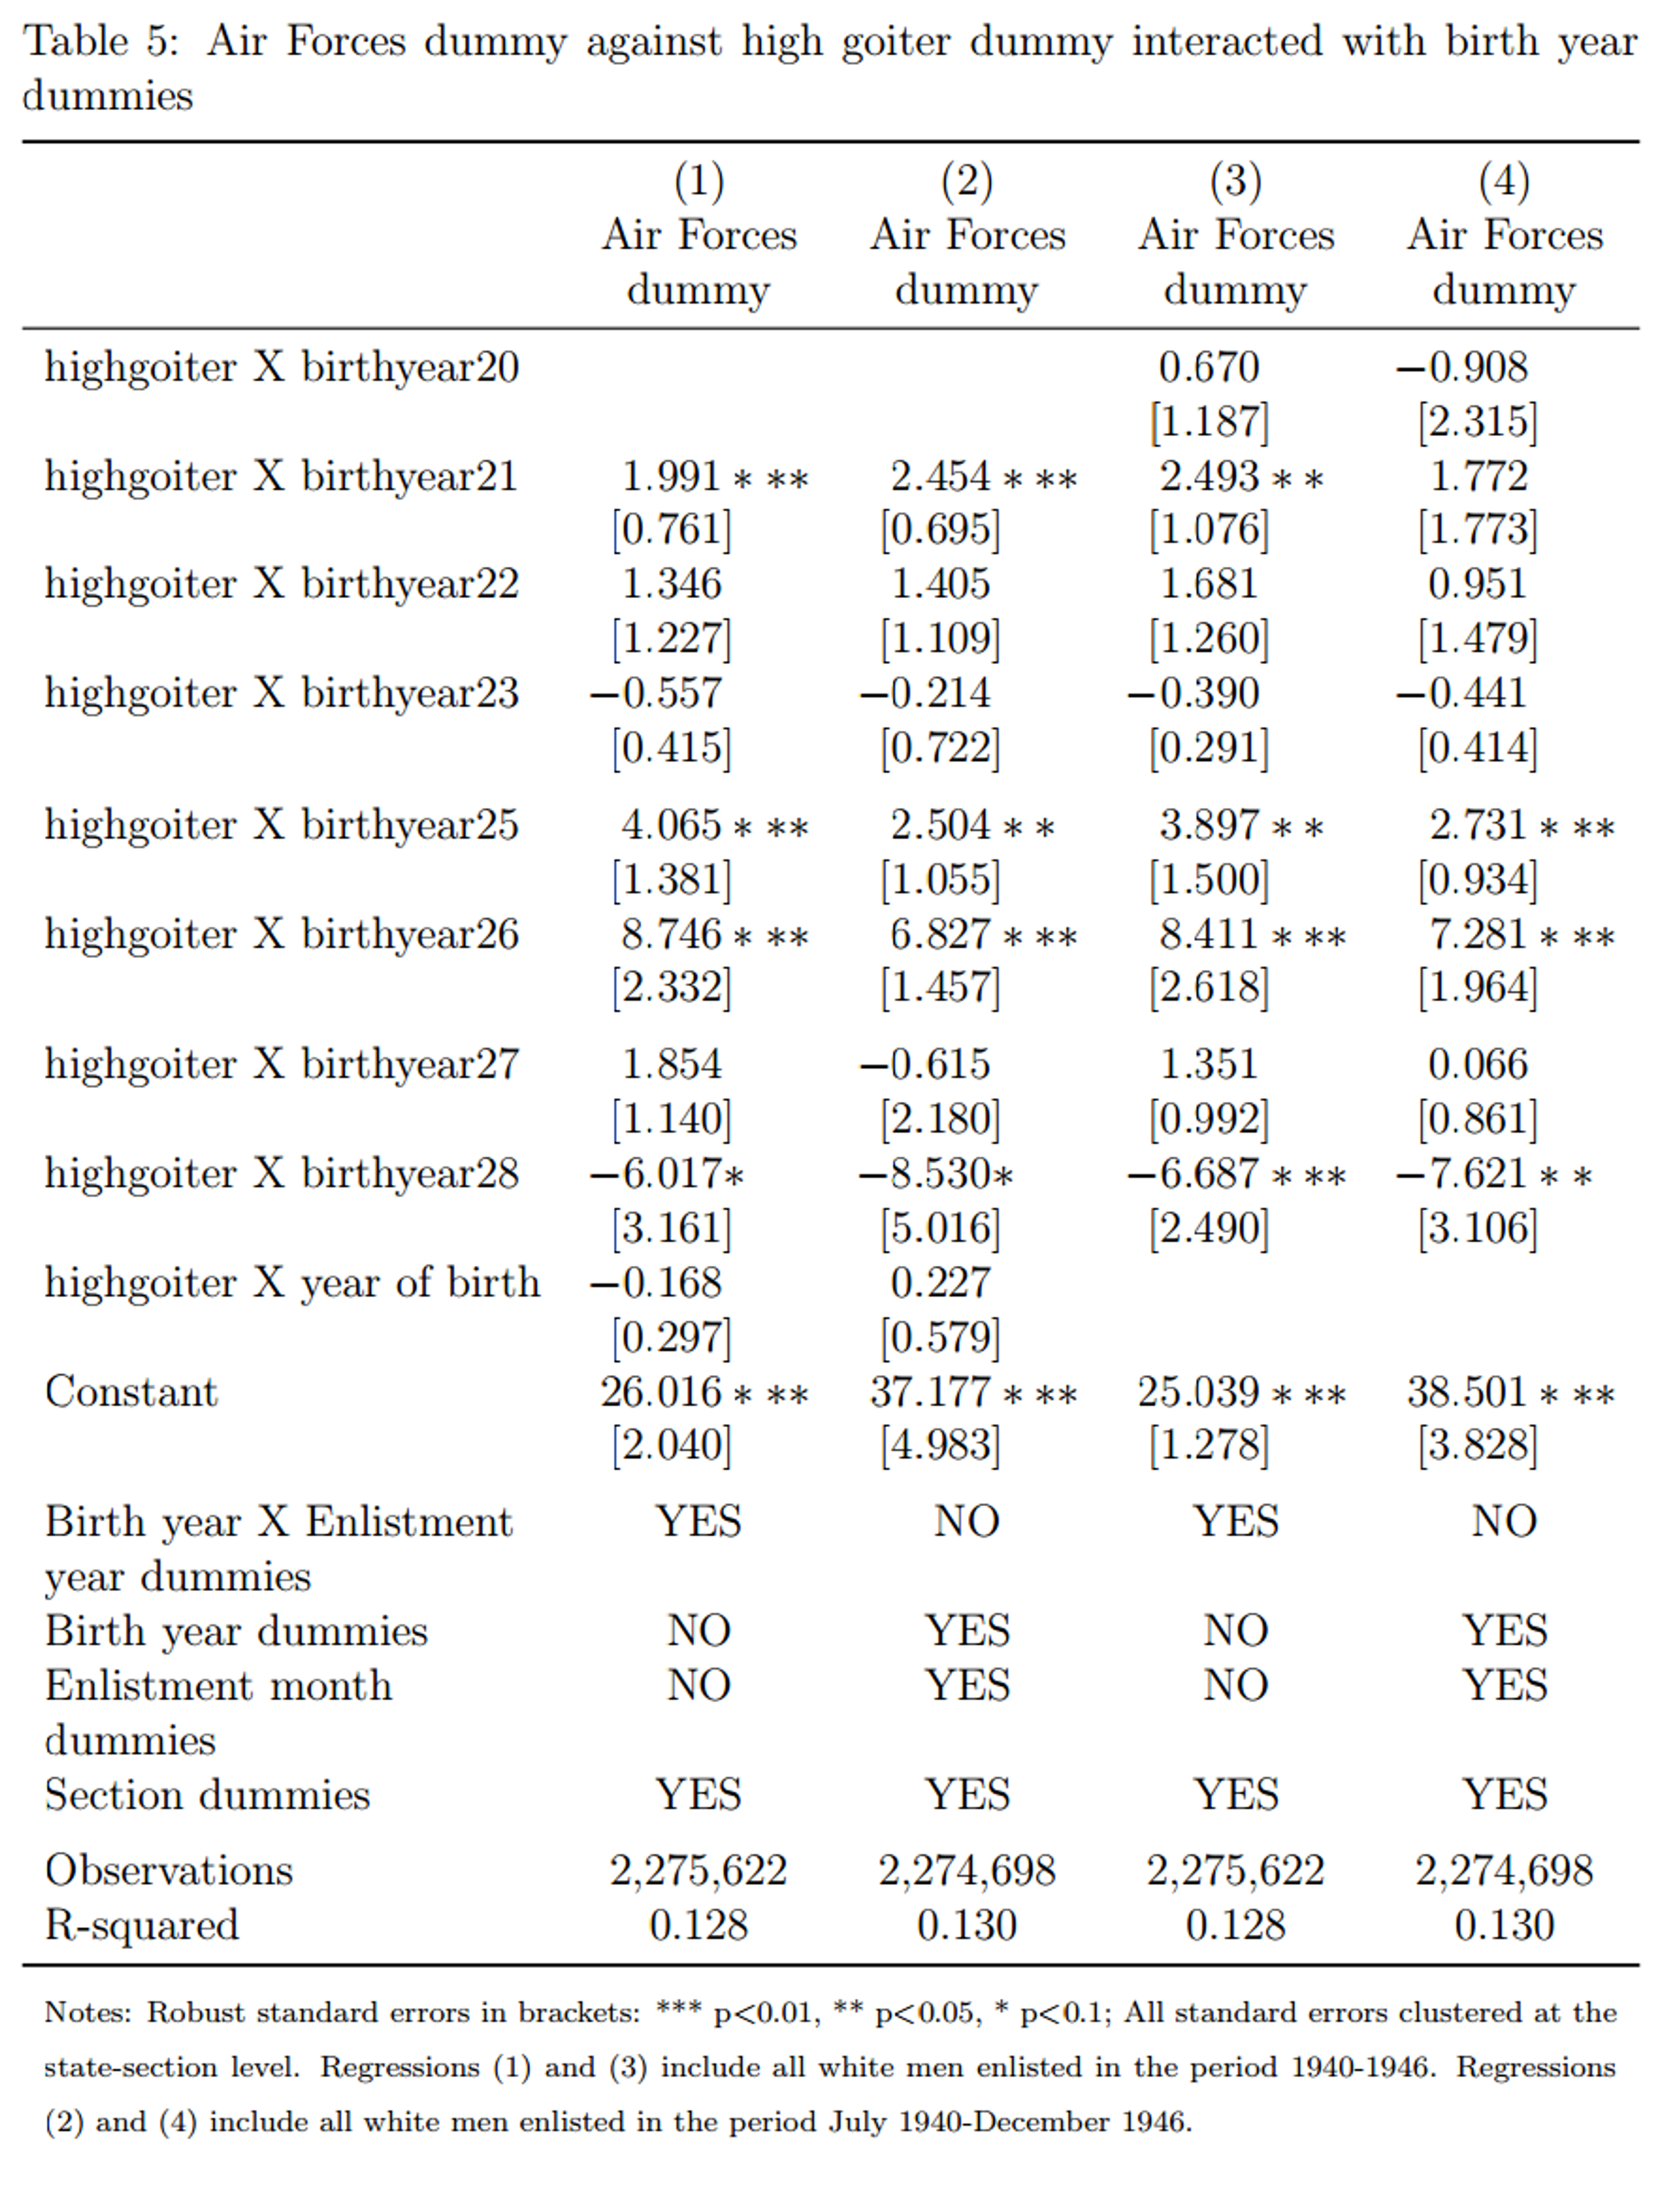
Note that all four specifications control for section (=region) and some combination of birth year and enlistment year. This means that for each data point, we are only trying to explain how it differs from the average for its section and its cohort. The interaction term highgoiter x birthyearZ asks the question: if you are from a high-goitre region and you were born in year Z, how much does this increase your probability of joining the air force, relative to the average for your section and year? In other words, how exceptional is year Z for high-goitre regions relative to non-high-goitre regions, having accounted for cohort average and section average? The coefficients are given in percentage points: for instance, in specification (1), being born in a high-goitre region in 1926 makes you 8.7 percentage points more likely to join the Air force than being from a non-high-goitre region and born in another year. The results are relatively consistent across the four regressions.
How do the authors translate this finding into an effect on IQ points? Given that 75% of air force recruits had an ACGT score above the mean (and 50% of all recruits had a score above the mean) the authors construct a model of the difference in the probability of joining the AAF between high- and low-goitre regions, as a function of IQ score difference in each region. I have not carefully vetted this model, but as far as I can tell it relies on very innocuous assumptions. The estimates of the effect of salt iodisation from table 5 range from 2.5 to 8.7 percentage points. Plugging the lower end of the range of into this model yields an impressive increase in IQ of 15 points for draftees from high-goitre regions potentially due to iodization. The upper range yields IQ increases well over 30 points. The authors consider this finding implausible, and I am inclined to agree. But what should we make of this? We could consider this a small piece of evidence for a very implausible claim, thus resulting in a very small increase in our credence that iodisation increases IQ by more than 30 points. An alternative interpretation is that these effects are too big to be believed, and this would increase our credence that the effect is somehow confounded (i.e. one of the assumptions is not met).
Doubts, reservations, and unanswered questions
Additional assumptions needed
As you can see in figure 17, the high and low goitre regions are systematically different in their probability of joining the air force (and surely in other respects too). This means we do not have a natural experiment in the strictest sense of the term. However, this is not a problem as long as we assume that the way in which they are systematically different does not happen to also cause a spike in their probability of joining the Air Force in 1925 or 1926. This seems like a reasonable assumption to make, especially given that our sample covers the entire United States.
I am further reassured by the falsification exercises conducted by the authors. They ran the same regressions using 58 other disorders instead of goitre. Data for these disorder was randomly selected from among disorders reported in Defects found in drafted men. The authors suggest that their results show that “the time pattern for goiter is replicated exactly […] in only six of 58 defects: exophthalmic goiter, acromegaly, multiple sclerosis, tabes dorsalis, curvature of the spine, and haemophilia. […] for all of these disorders there exists a link connecting them to iodine deficiency.” This falsification exercise makes less likely the possibility that the effect is caused by some other health improvement that co-occurred with iodisation.
Problems with the data
The WW2 enlistment data does not include the county of birth, but only the state. The authors suggest that this limits their sample “to individuals whose birth state is identical to their state of residence” and make the assumption that “the county of residence upon enlistment is the county of birth". There are two potential problems with this assumption. First, there could be systematic migration away from or to high goitre areas within the same state, and so treatment individuals might have been counted as controls or vice versa. This would underestimate the difference between treatment and control and thus underestimate the effect. Second, excluding those who move to another state (close to half the sample) could mean excluding some systematically different sub-group. Overall, I do not believe that these problems undermine the central result.
Publication bias
Publication bias (selective reporting of the correlations that support a thesis) is always a potential problem when a study was conducted on pre-existing data, because several statistical tests could be run until a significant result is found. However, in footnote 40, the authors are open about the trying to use education as an outcome but finding no effect. If this was the only other analysis they ran then, adjusting the results for two tests would likely still leave the results significant (c.f. Multiple comparisons problem).
Evaluating Politi (2010): Salt iodization in Switzerland
This paper uses the same natural experiment design as Weil et al. (2013), so it should be easier to explain now that you are familiar with it.
Salt iodisation began in 1922 in Switzerland. Information on goitre prevalence comes from an 1883 monograph10, which recorded “goiter data taken from recruits during the period 1875- 1880 for all towns and villages in Switzerland”.
Cognitive outcomes were measured using data from the 1970 census, which recorded the place of birth and education level of each individual. This allows us to infer the share of the population born in a certain town or village that has completed secondary of tertiary education.
Results using 1922 as a cut-off point
As in Weil et al. (2013), the date of the introduction of salt iodisation can be used as the date of treatment for a differences-in-differences analysis.
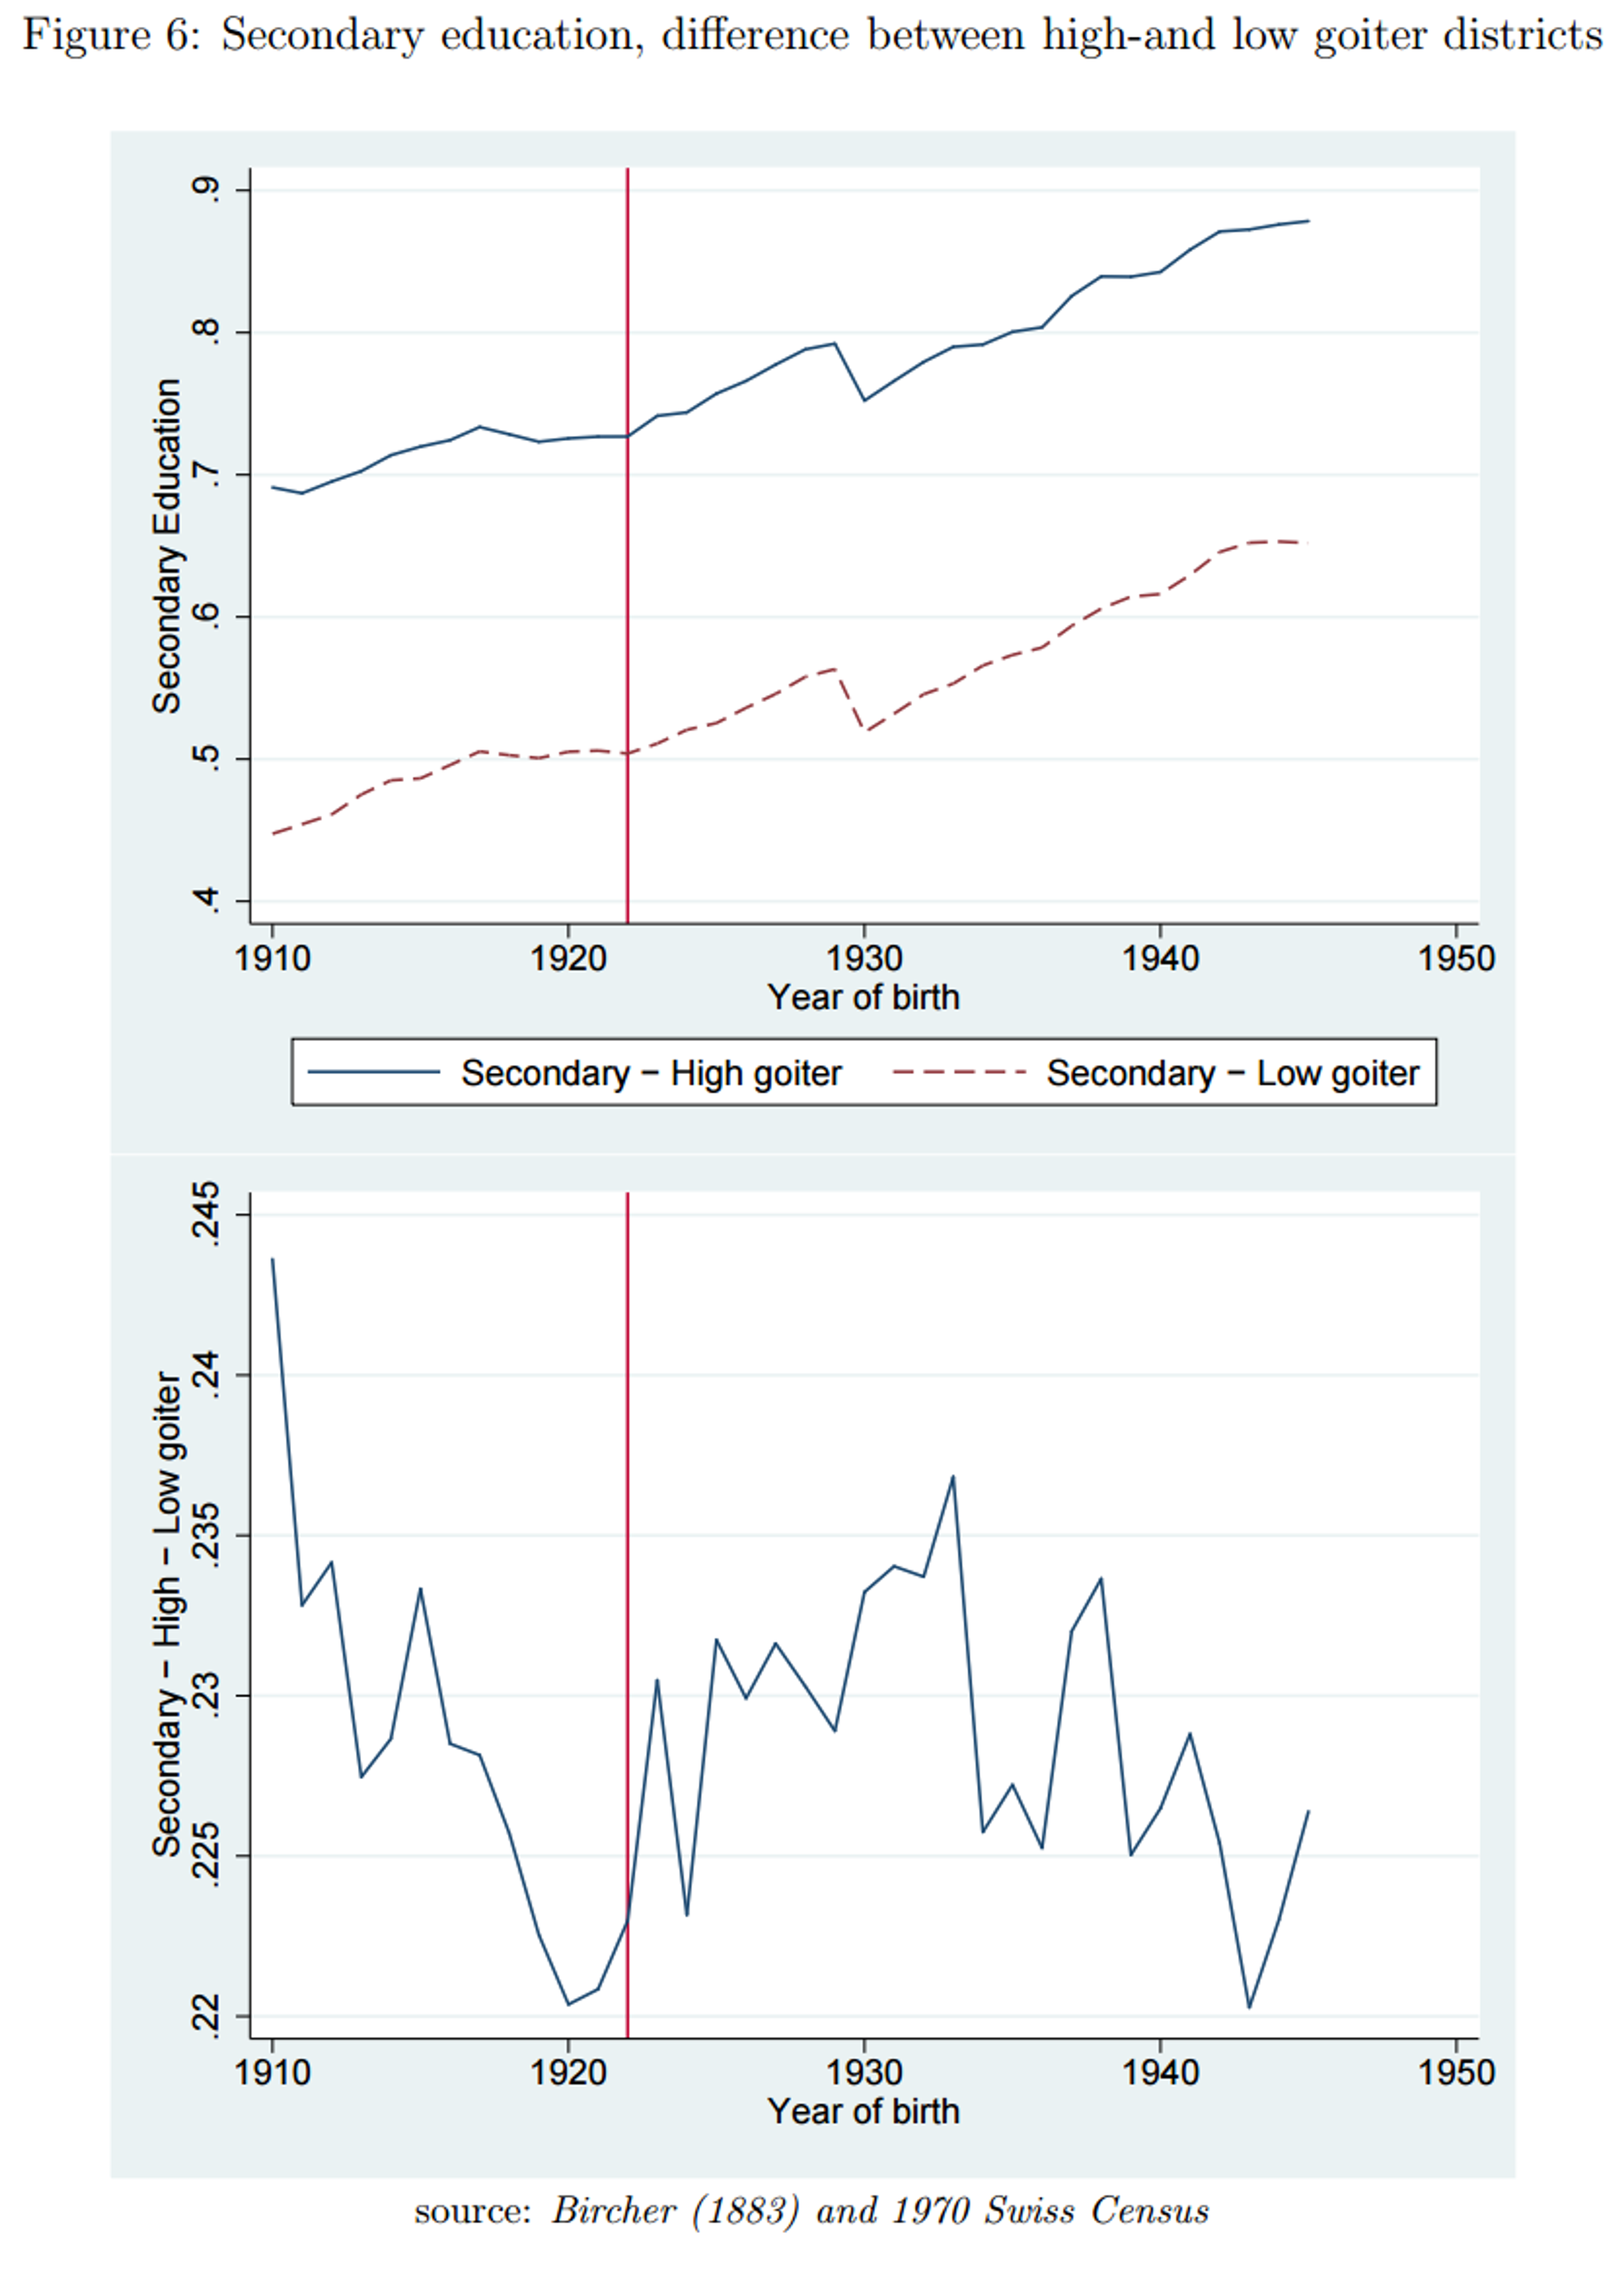
In this graph, the Y-axis indicates the probability of graduating from secondary education. The author explains that this is a regression-adjusted graph: it shows the probability of graduating from secondary education after controlling for district fixed effects and a district time trend. A district fixed effects control would mean we are only looking at how each data point differs from the average for its district. Looking at the top panel, the line for high-goitre regions is consistently higher than the low goitre regions. I do not understand how this could happen when controlling for district fixed effects.11
Let’s look at the bottom panel, which shows the difference between high and low goitre districts. If salt iodisation had an effect on graduation rates, we would expect an increase in the difference between high and low goitre regions after 1922. There is an unexplained downward trend before 1922, which makes the increase after 1922 hard to assess: depending on what value is taken to represent the situation before 1922, there is more or less of an increase after 1922. On the most generous interpretation, there is an increase of less than one percentage point in the difference between high and low goitre regions.
In order to better quantify this effect, the author runs a regression with a “born-after-1922” dummy variable. This means she takes the average of the pre-1922 and of the post-1922 period to represent each period. This dummy variable interacts with a high-goitre dummy. The regressions highlighted in red in the table below correspond to the bottom panel in figure 6. It is not clear to me how this coefficient can be so much higher than what we inferred from the graph.12

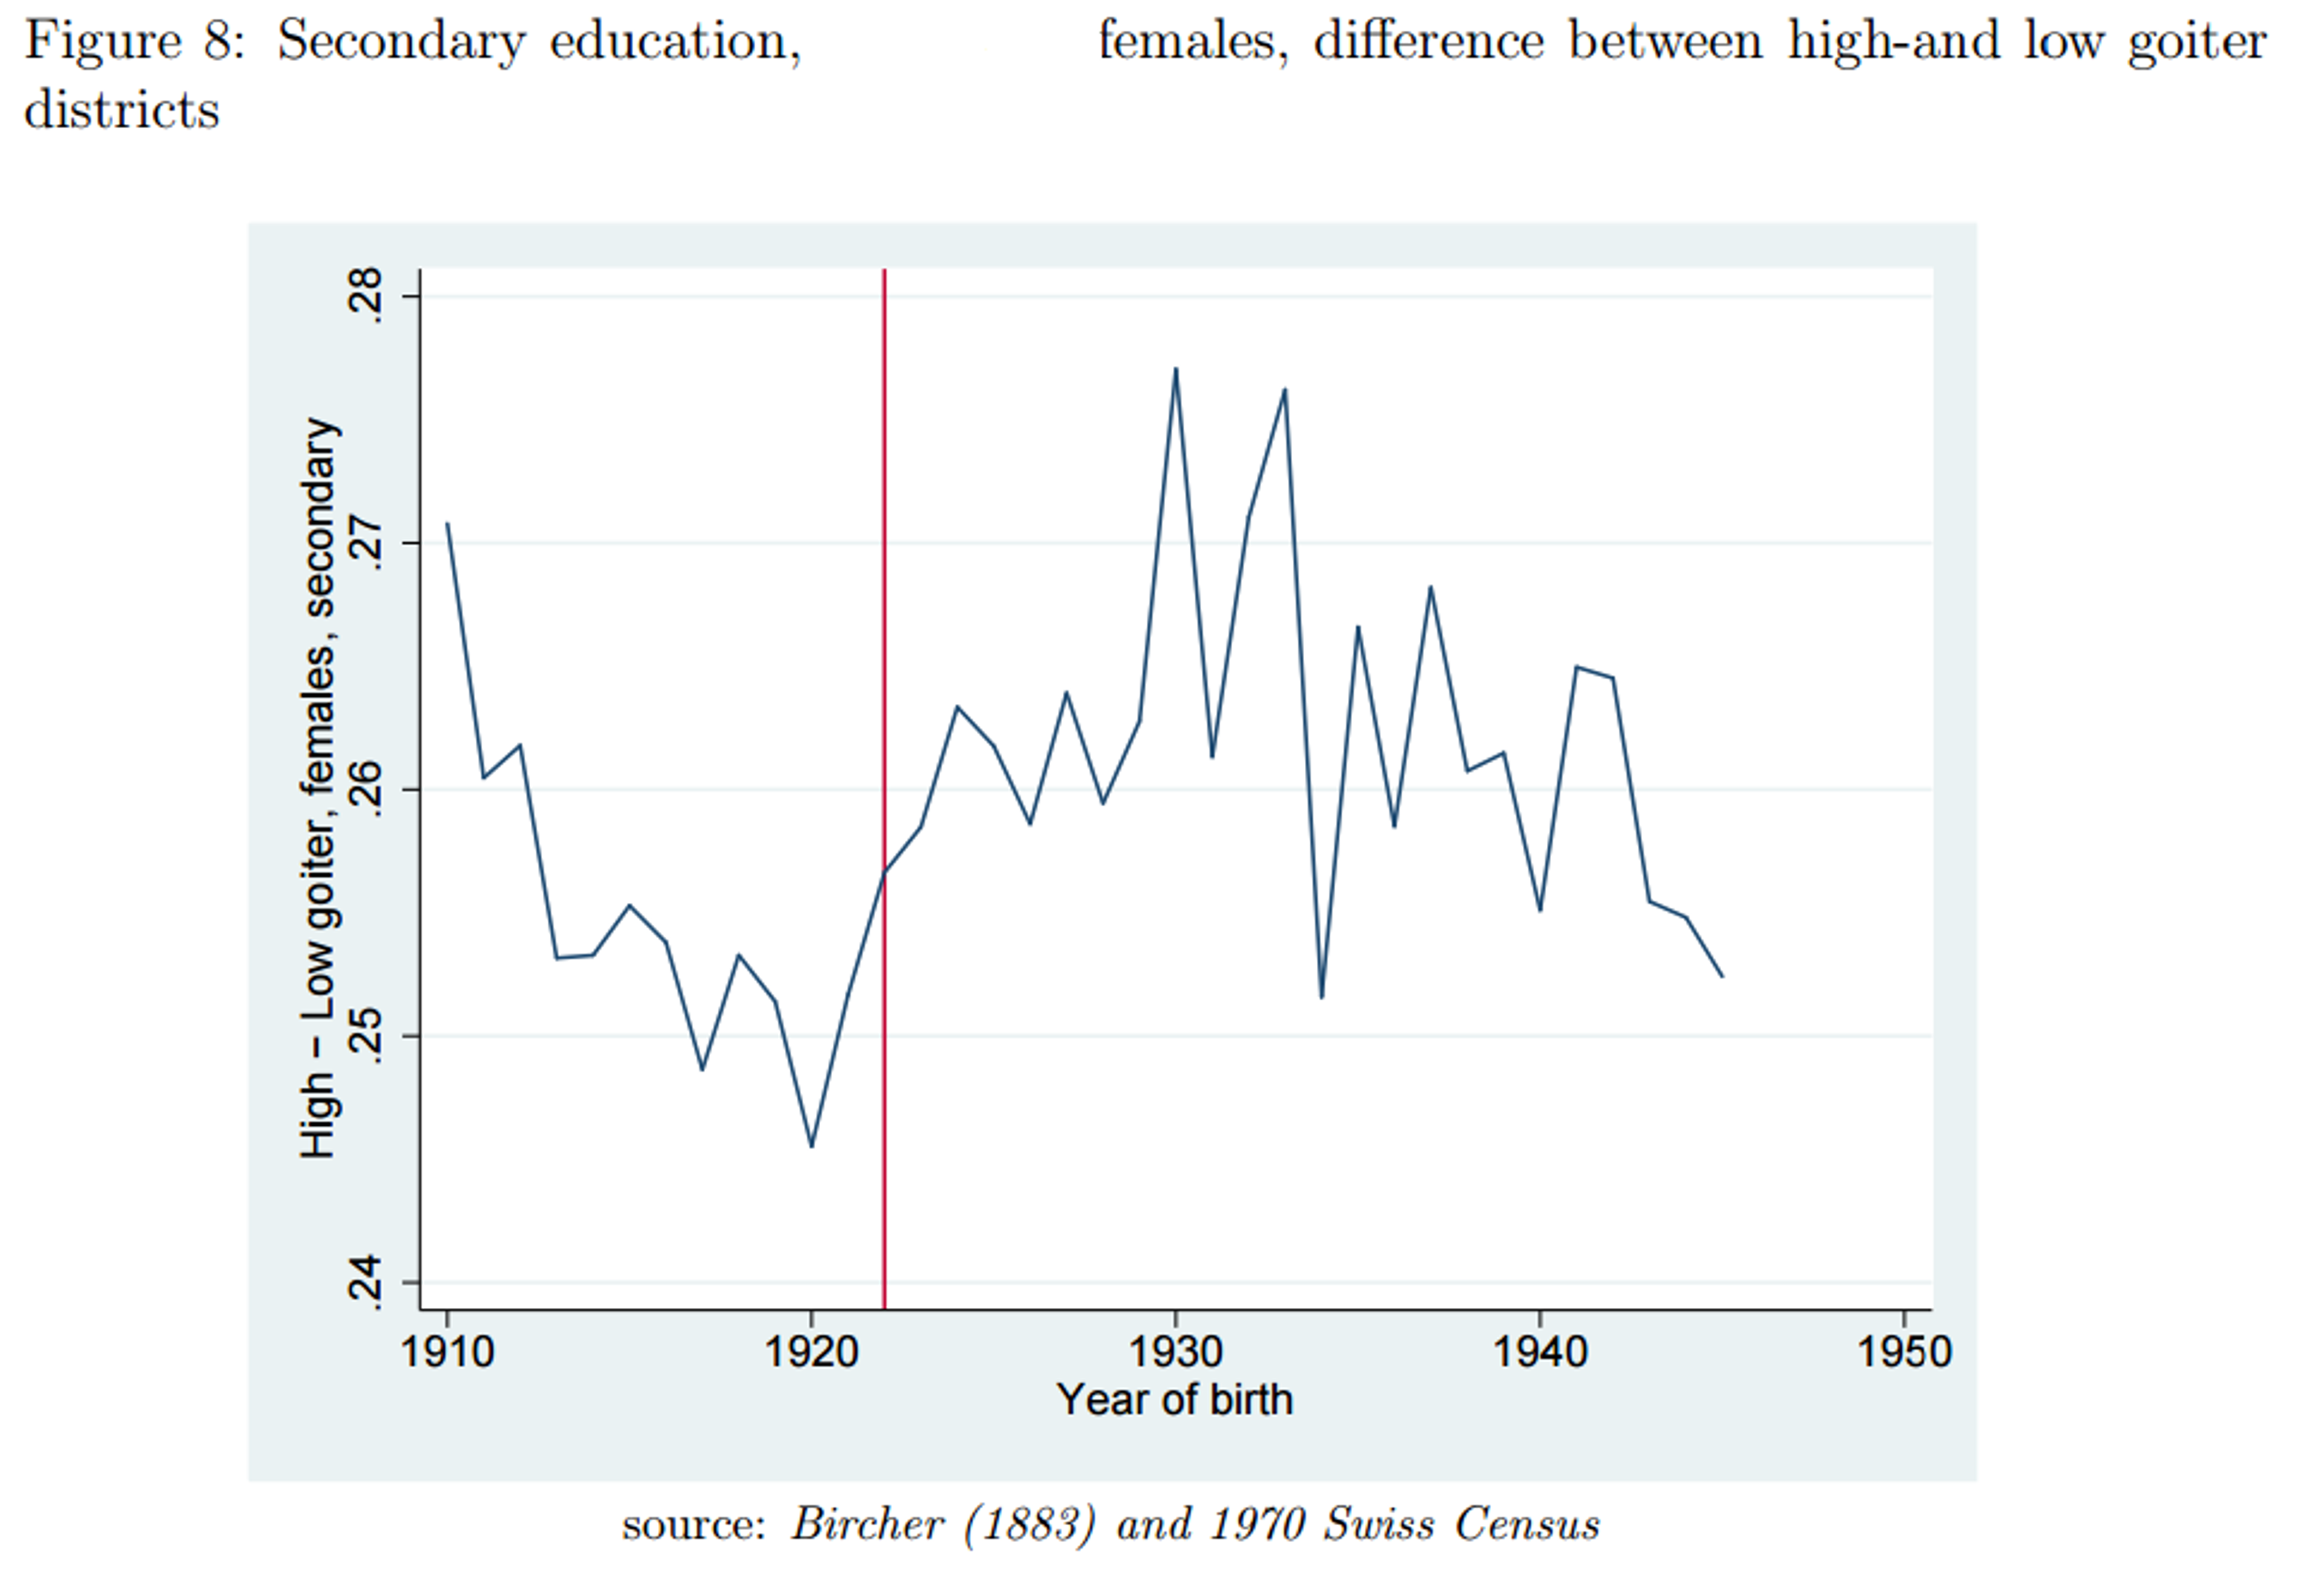
As you can see in this table, the author also ran regressions for looking at tertiary education, at the effect on males and females separately13, and at a shorter range of cohorts. Looking at males vs females we see that the effect is almost entirely driven by females. While coefficients for males are only small and statistically insignificant, coefficients for females are large and significant. This regression attributed to iodisation between a 1.2 and a 2.7 percentage point increase in secondary graduation rates of females. The 1.2 figure appears roughly to match figure 8.
How uniform was the availability of iodised salt?
Was iodised salt introduced quickly and uniformly across Switzerland? There is in fact data on this, drawn from Wespi (1962).
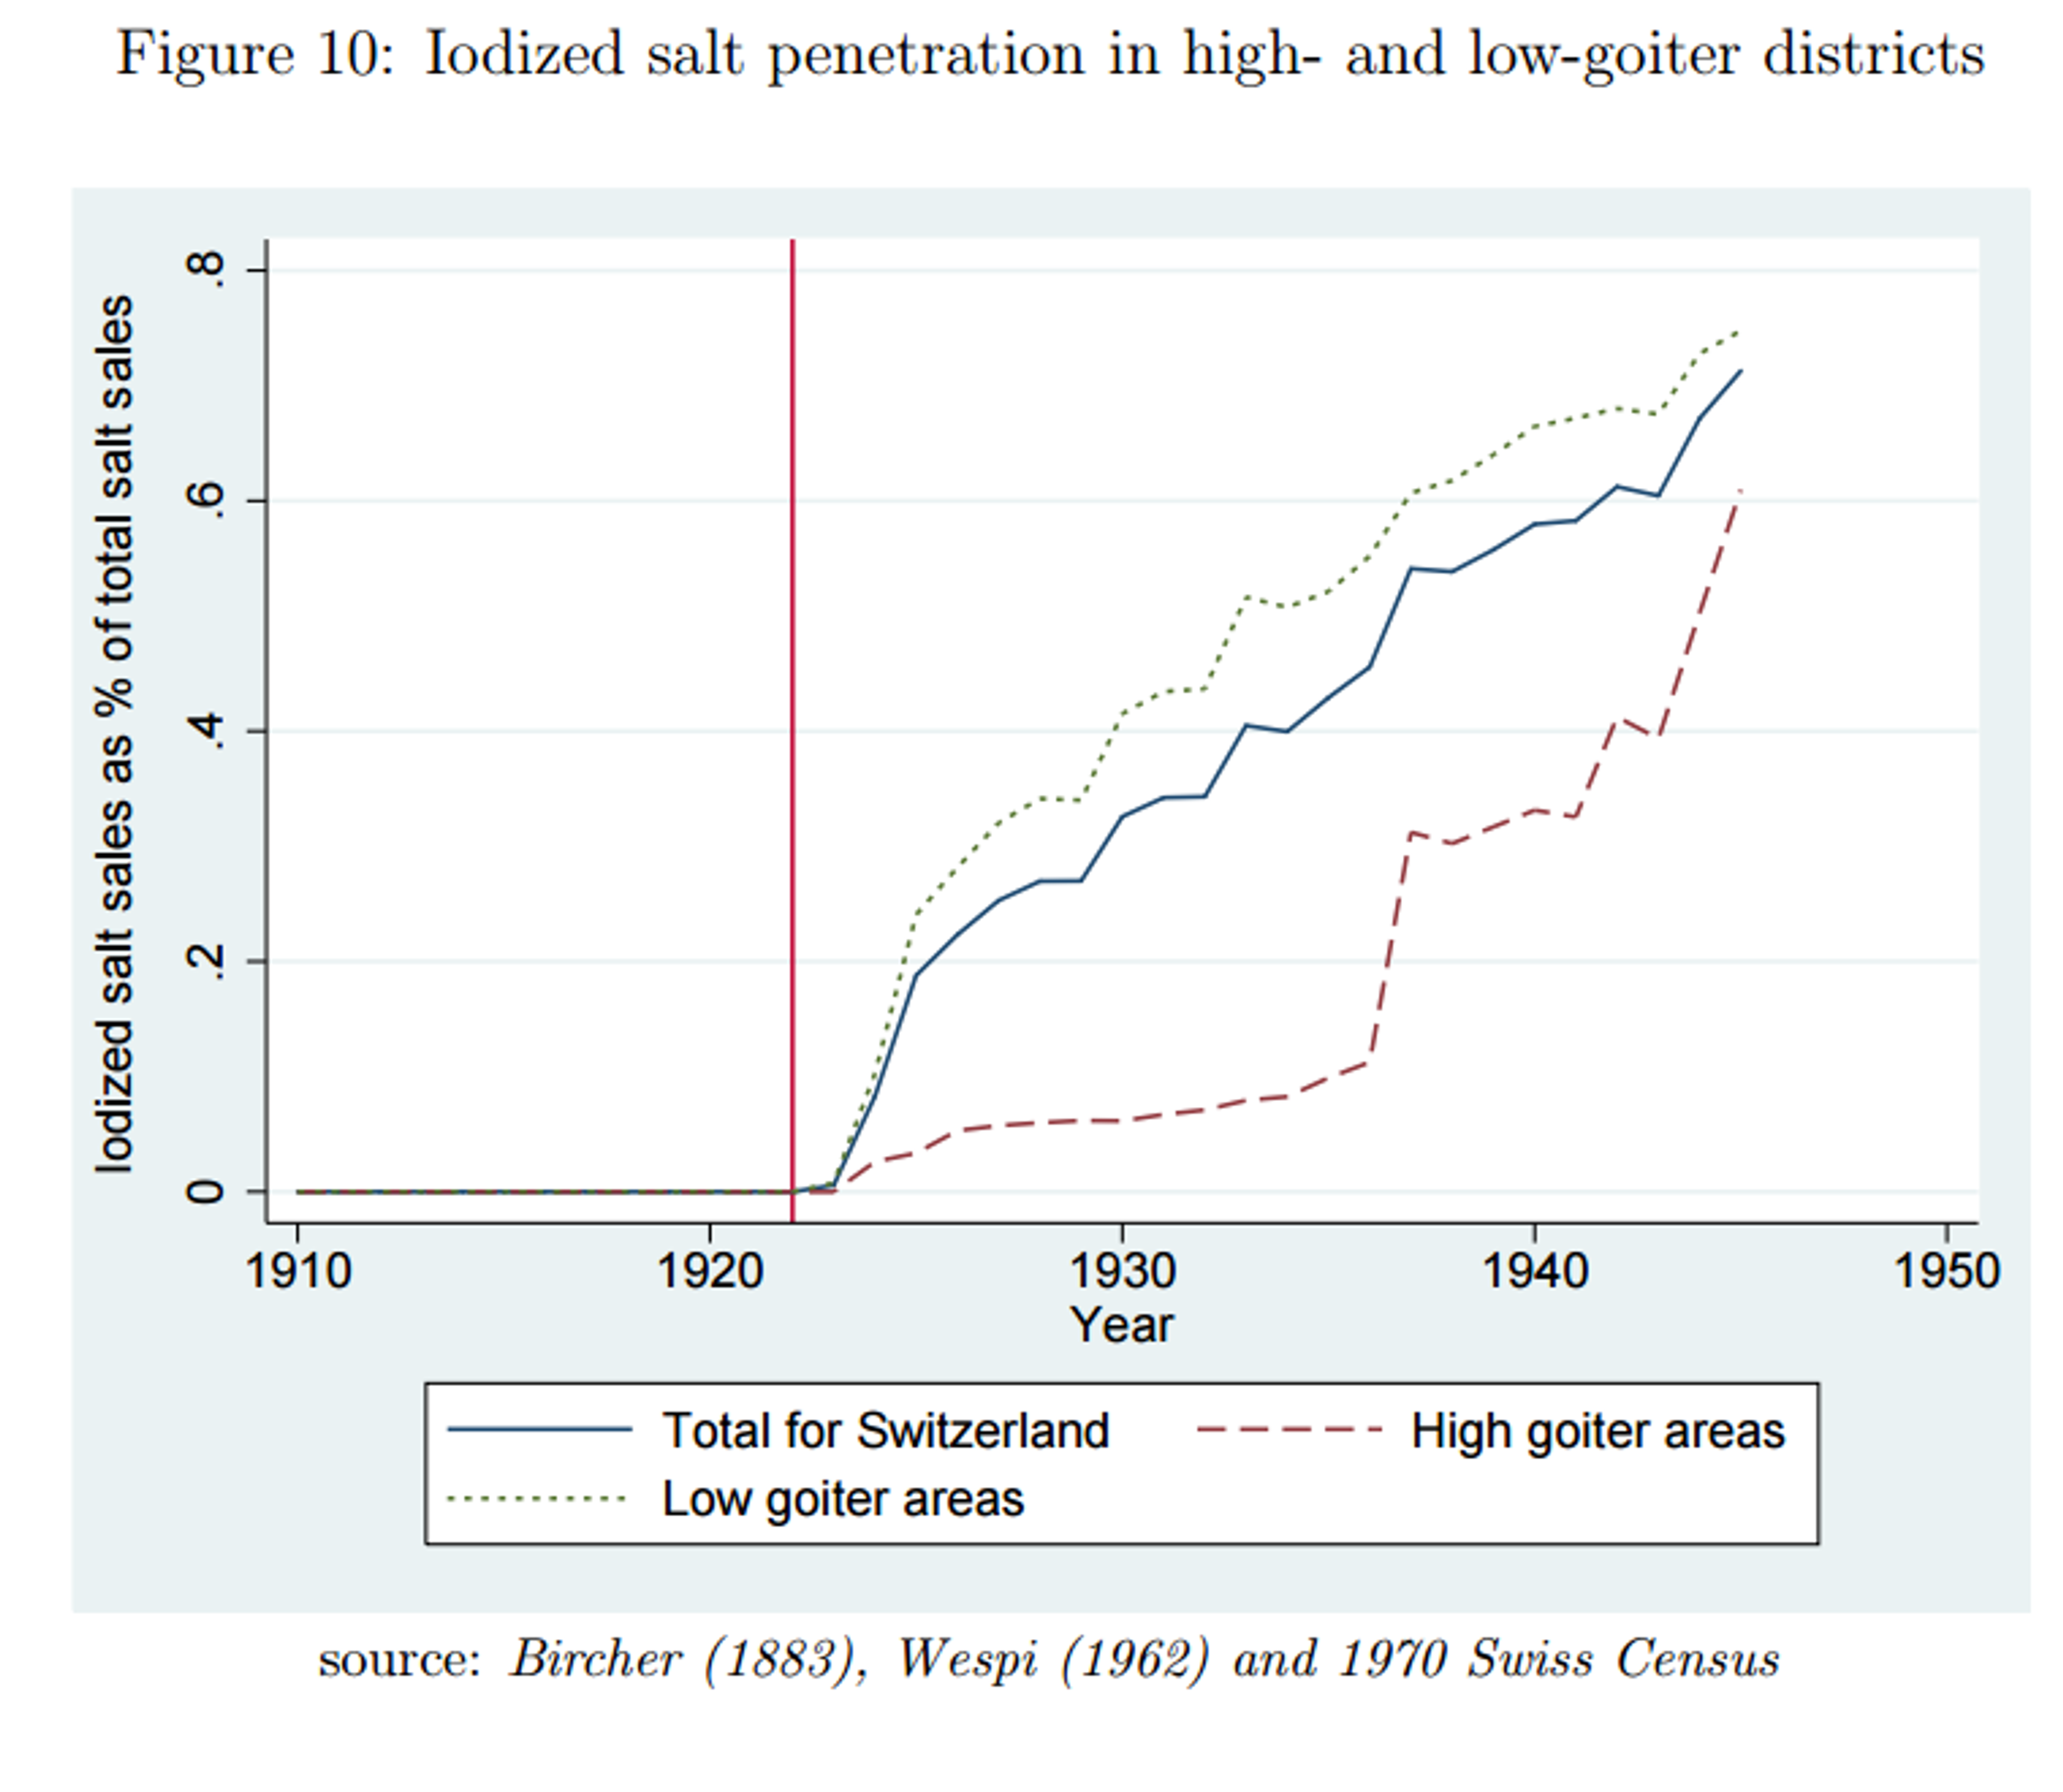
Iodised salt was introduced much later in high-goitre areas. To what extent does this undermine the natural experiment? The fact that low goitre areas (the control group) received a large increase in iodised salt at the time may not be as bad as it seems: we are already assuming, as the basis for this whole analysis, that the effect of iodisation on iodine sufficient districts is very low and thus this might lead to underestimating the effect size. What is more worrying is that high goitre areas (the treatment group) only appear to have received 5% salt iodisation exposure after 1922. We would have to assume that the aforementioned effects are due to this increase, from 0% iodised salt to 5% iodised salt. The author tries to reconcile the findings by suggesting that the effect of iodine is strongly degressive: the first 5% have a disproportionate effect on iodine deficiency. I have not carefully examined whether this is biologically plausible, but a priori I am sceptical.
Results using the jump in iodised salt sales
The data from Wespi 1962 opens up a new possibility. The author writes:
“A closer look into the iodized salt sales data reveals that the transition to iodized salt happened pretty rapidly for most cantons. I take advantage of such sudden jumps in iodized salt sales, as they correspond to jumps in the probability of being treated. Based on the year of the jump in iodized salt sales, which is particular to each canton, I construct a new variable, “age relative to iodization””
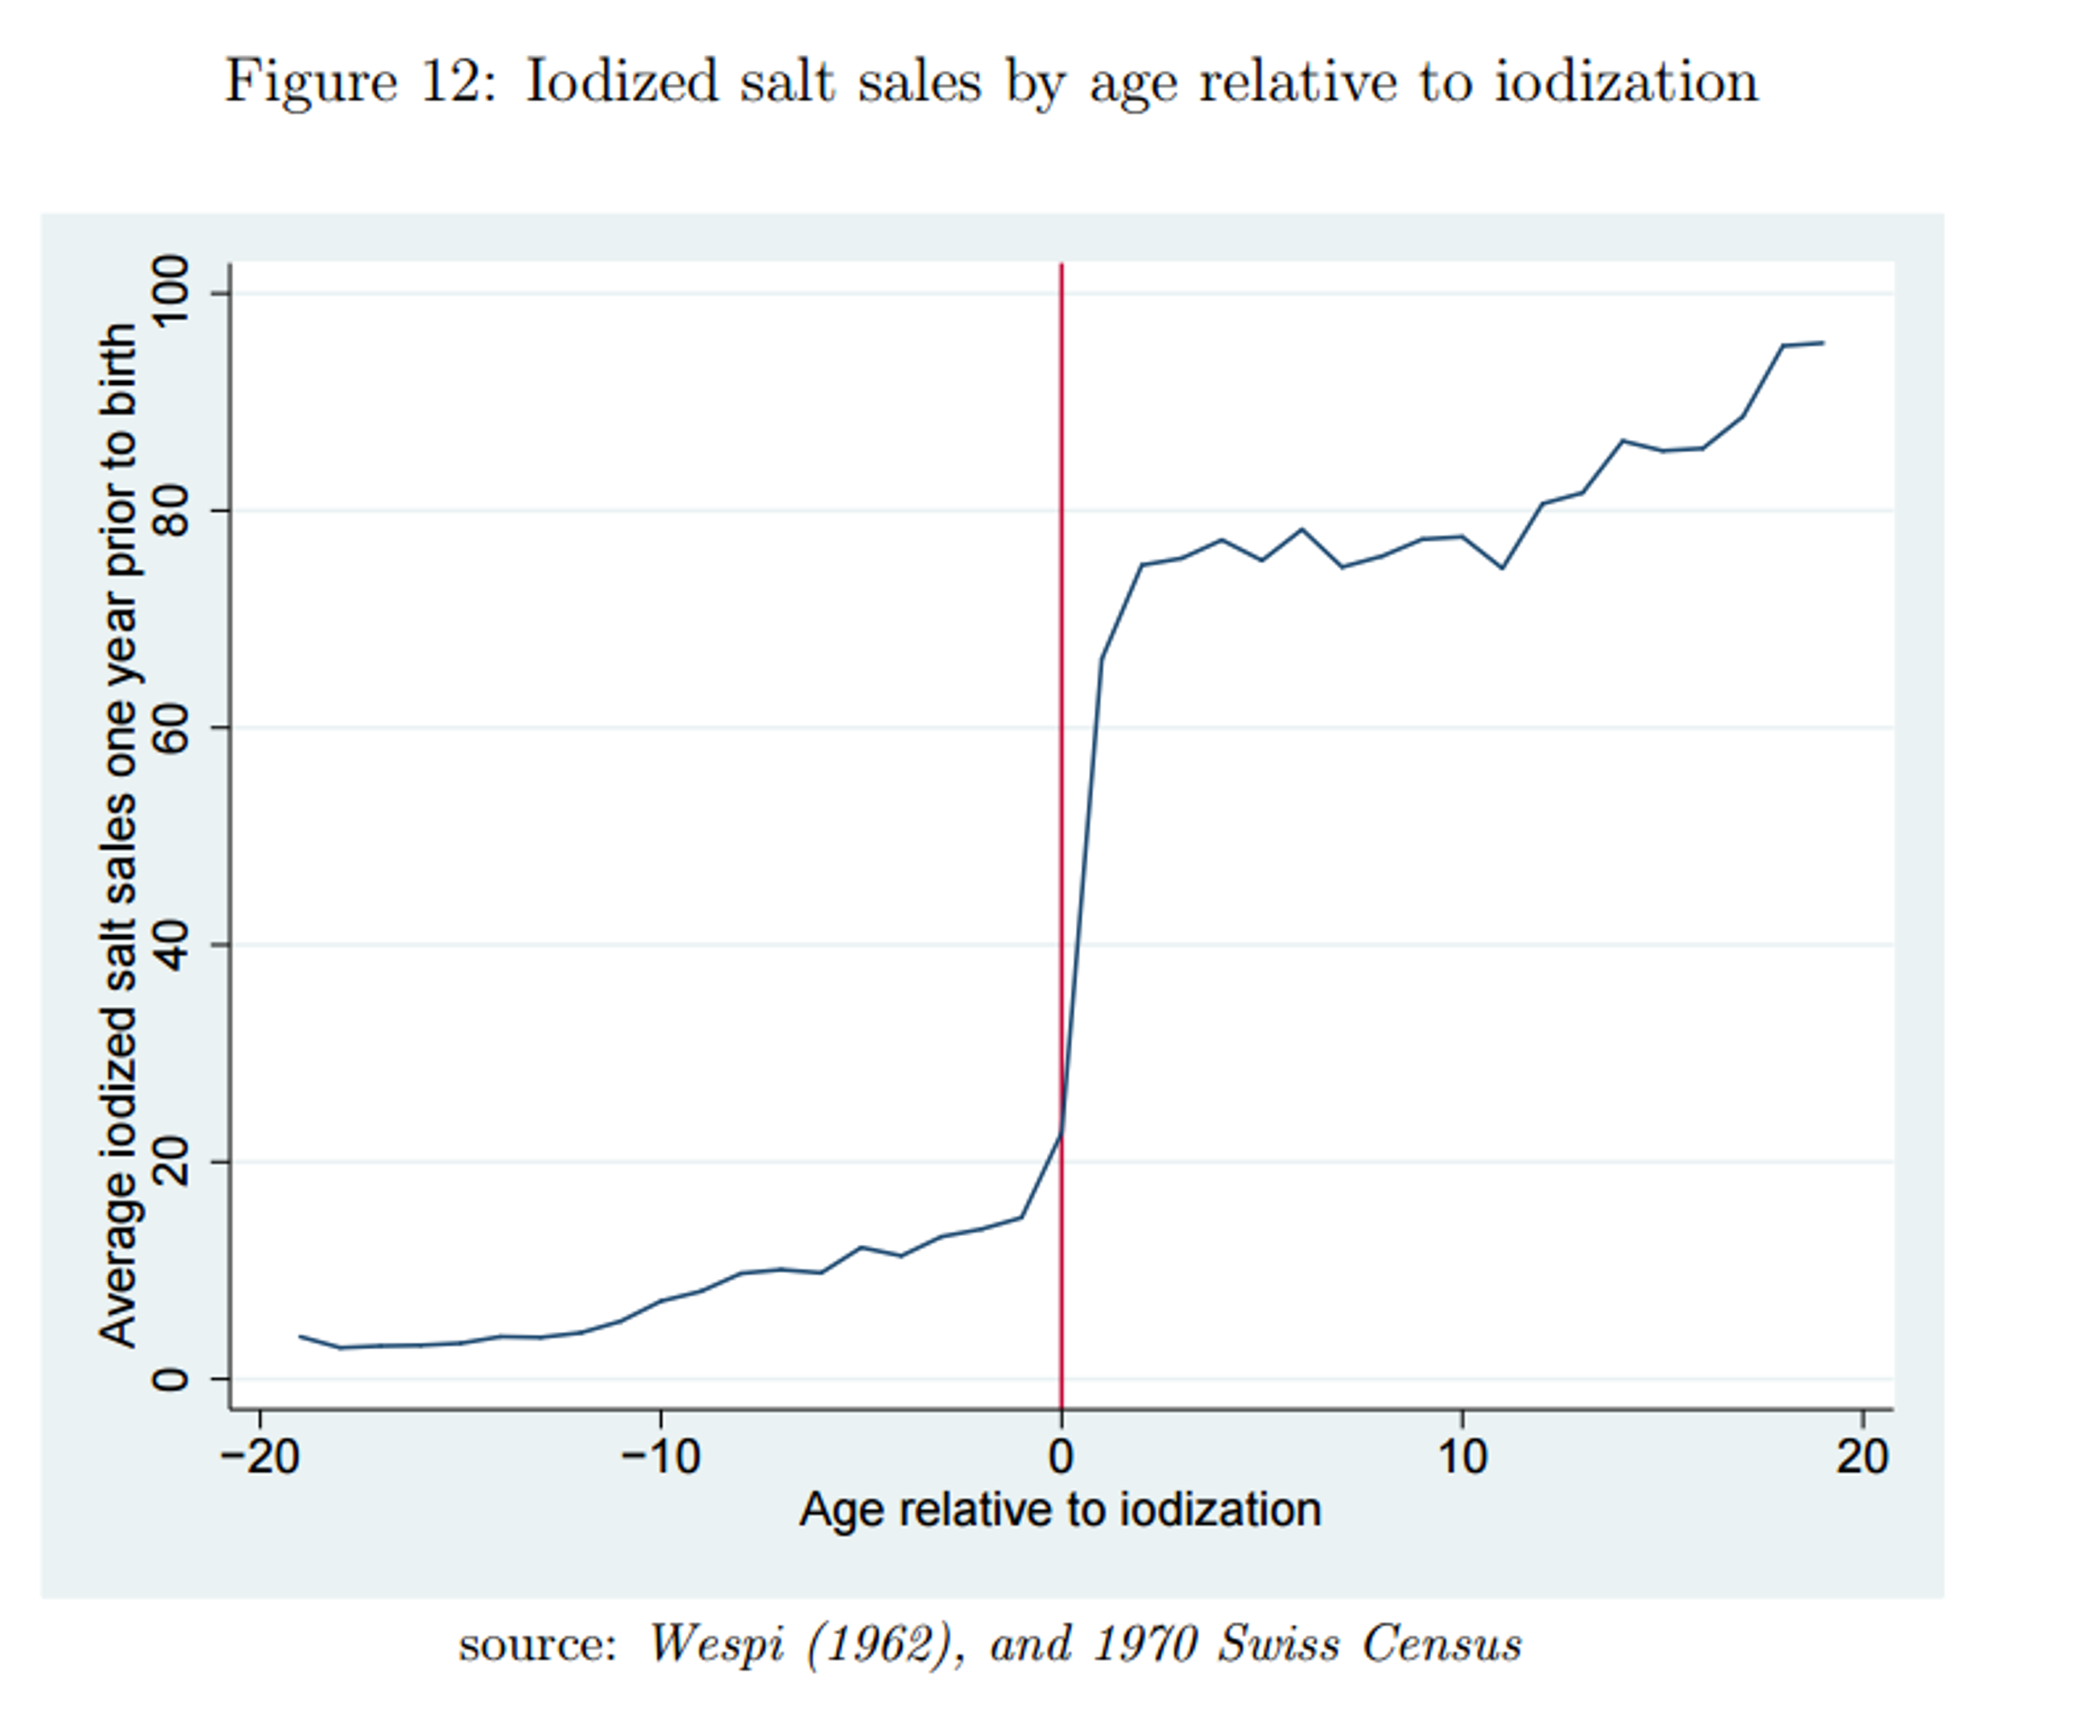
The author then looks at the difference between high and low goitre districts, before and after a jump in iodised salt sales. The advantage is that as you can see in figure 12, we now have a large treatment size rather than 5%. The problem is that we are now no longer looking at a simultaneous introduction of salt, making this even less of a natural experiment than it was before. The effect could be confounded by economic development (when districts become more developed, they acquire access to iodised salt and there is more of an incentive to finish secondary school), or by myriad other things. In order to conclude that Weil et al. (2013) is confounded, we would have had to assume that high-goitre regions happen to get a simultaneous spike in cognitive performance, a strong assumption. In contradistinction, for Politi (2010) we only have to assume that graduation rates happen to increase simultaneously with local salt sales in order to conclude that the effect is confounded.
Other limitations
A further potential source of bias is the limitations of the pre-existing goiter data (Bircher 1883). In addition to being simply quite old and perhaps more prone to measurement error, these data were collected in 1875-1880, so that the goitre distribution in Switzerland in 1921 might have looked quite different.
Risks of salt iodisation
Sudden large increases in iodine consumption of chronically iodine deficient people can lead to a deadly type of thyroid inflation called exophthalmic goiter. This is because the body cannot quickly adapt to the sudden intake of otherwise adequate levels of iodine. Weil et al. (2013) finds evidence that iodine deficient regions saw increased death rates from exophthalmic goitre after salt iodisation was introduced.
While this is a large increase, thyroid related mortality is still only between 2 and 3 people per 100 000, or two or three thousandths of one percent. This cost must be weighed against other non-cognitive potential benefits to larger numbers of people such as the reduction of cretinism and deaf-mutism born to highly deficient mothers14.
Conclusions: what is the bottom line?
I find Weil et al. (2013) to be the more convincing paper. The strongest point against it may be that its results imply an effect too large to be plausible.
The benefits of iodisation may depend on other factors in the environment. Even if there were large effects in the United States and Switzerland in the 1920s, they may depend on conditions that are not met in developing countries today.
Based on the WHO meta-analysis15, I am not aware of any other literature on iodisation that is not already included the GiveWell’s report. Please email me if you are aware of any such study.
Overall, how much should this evidence change our views? 15 IQ points corresponds to an effect size 3.75 times bigger than GiveWell’s best guess. However, I have less than 20% credence that there will truly be such a benefit when salt iodisation is introduced in developing countries.