Measuring global inequality: Median income, GDP per capita, and the Gini Index
Income can vary dramatically between and within countries. Measures like GDP per capita, average income, median income, and Gini Index are important to understand how best to allocate our resources to solve global poverty.
To determine where our charitable donations might be most effective, it is useful to think about how wealth, income, and poverty are distributed around the world. Measuring these things can be very complicated and still is the subject of ongoing research. In this post, we will compare a few of the most commonly used measures and point out some of the subtleties that can arise in the study of global poverty.
Wondering where your income ranks in the world?
Use the 'How Rich Am I?' calculator
Gross domestic product (GDP) per capita
The most widely used measure of global income distribution is GDP per capita. Gross domestic product, or GDP, is the total monetary value of all the final goods and services produced within a country in a given year. GDP per capita is a country's GDP divided by its population. GDP per capita figures vary significantly across the world.
Figure 1. GDP per capita throughout the world
Source: Our World in Data
However, looking at each country's GDP per capita isn't the best way to understand how well a country is doing. Because GDP excludes activities that don't take place in markets, many factors can contribute to a country's GDP without affecting the quality of life of its residents. For example, damages caused by pollution aren't captured by GDP if nobody pays a price for them. Conversely, beneficial activities like housework or spending time with family do not get accounted for by GDP.
Income
Because a country's GDP doesn't necessarily reflect its citizens' welfare, it is often more useful to look at the actual incomes of people in a country to determine their wealth rather than the total amount of economic activity (GDP). If we simply calculated the total income of a country's population, countries with large populations would often appear wealthier than countries with smaller populations. And if we just looked at GDP per capita, we might neglect to account for the harmful effects of inequality. Therefore, we will generally look at the mean income (the total income of people in the country, divided by the population) or the median income (the middle value in the list of everyone's salaries written in sequential order).
For most countries, measures of income tell a very different story than the measure of GDP. One might imagine that the difference between mean income and GDP per capita is small, but these numbers often diverge. For example, the 2018 GDP per capita of the US was about $63,000, whereas the 2018 mean income was only $26,988.1 Because GDP accounts for not just consumption, but investments, net exports, and government spending, these numbers can be quite different. Since we're primarily concerned that people who live in extreme poverty don't have enough for basic necessities, it can be more useful to look at how much money they have to spend on goods and services in a given year.
Figure 2. Median income, GDP per capita, and inequality: Selected countries

GDP per capita (PPP) compared to median income (PPP)
Note: The size of each country's circle represents its Gini index.
Data source: The World Bank, PovcalNet
Mean income vs. median income
Perhaps you're convinced that income is more useful than GDP for understanding poverty — or at least that it's worth looking at. But should we use the mean income, the median income, or some other measure?
To understand the difference, let's look at a simple example:
Let's say the following list represents the annual incomes of a small island country with a population of five:
Ben: $10,000
Carlos: $20,000
Dora: $30,000
Erica: $40,000
Frances: $50,000
The total value of the islanders' incomes is $150,000 per year. By dividing this total by the number of inhabitants on the island (five), we can calculate a mean income of $30,000. The median income — the middle value in our ordered list of incomes — is also $30,000. So in this example, the mean and median incomes are identical because the distribution is symmetric. An equal number of islanders have relatively high incomes and relatively low incomes. But this is quite unrealistic: in the real world, there are a few extremely rich people and many more people living in extreme poverty.
Now let's imagine that two new people move to the island simultaneously: Alicia and Gerard. Alicia has an income of $0 because she has struggled to find employment for quite some time, whereas Gerard is a highly paid athlete. What would happen to the per capita income and the median income of the island?
Alicia: $0
Ben: $10,000
Carlos: $20,000
Dora: $30,000
Erica: $40,000
Frances: $50,000
Gerard: $100,000,000
The country's median income would stay the same because $30,000 is still the middle value in the ordered list. However, mean income would skyrocket to just over $14,000,000 — close to a 50,000% increase!
What would looking at that mean income number tell us? Not a whole lot, actually. The $14,000,000 figure is a useless descriptor of the financial wellbeing of the island's inhabitants (even Gerard, whose salary is many times this number). In contrast, the median is a more useful measure. Still, even the median fails to describe how well off the lowest income person on the island is.
Though somewhat less extreme, precisely the same issues arise when we study real countries. The distribution of annual household income in the US is very far from symmetric:
Figure 3. Household Income Distribution in the United States (2019)
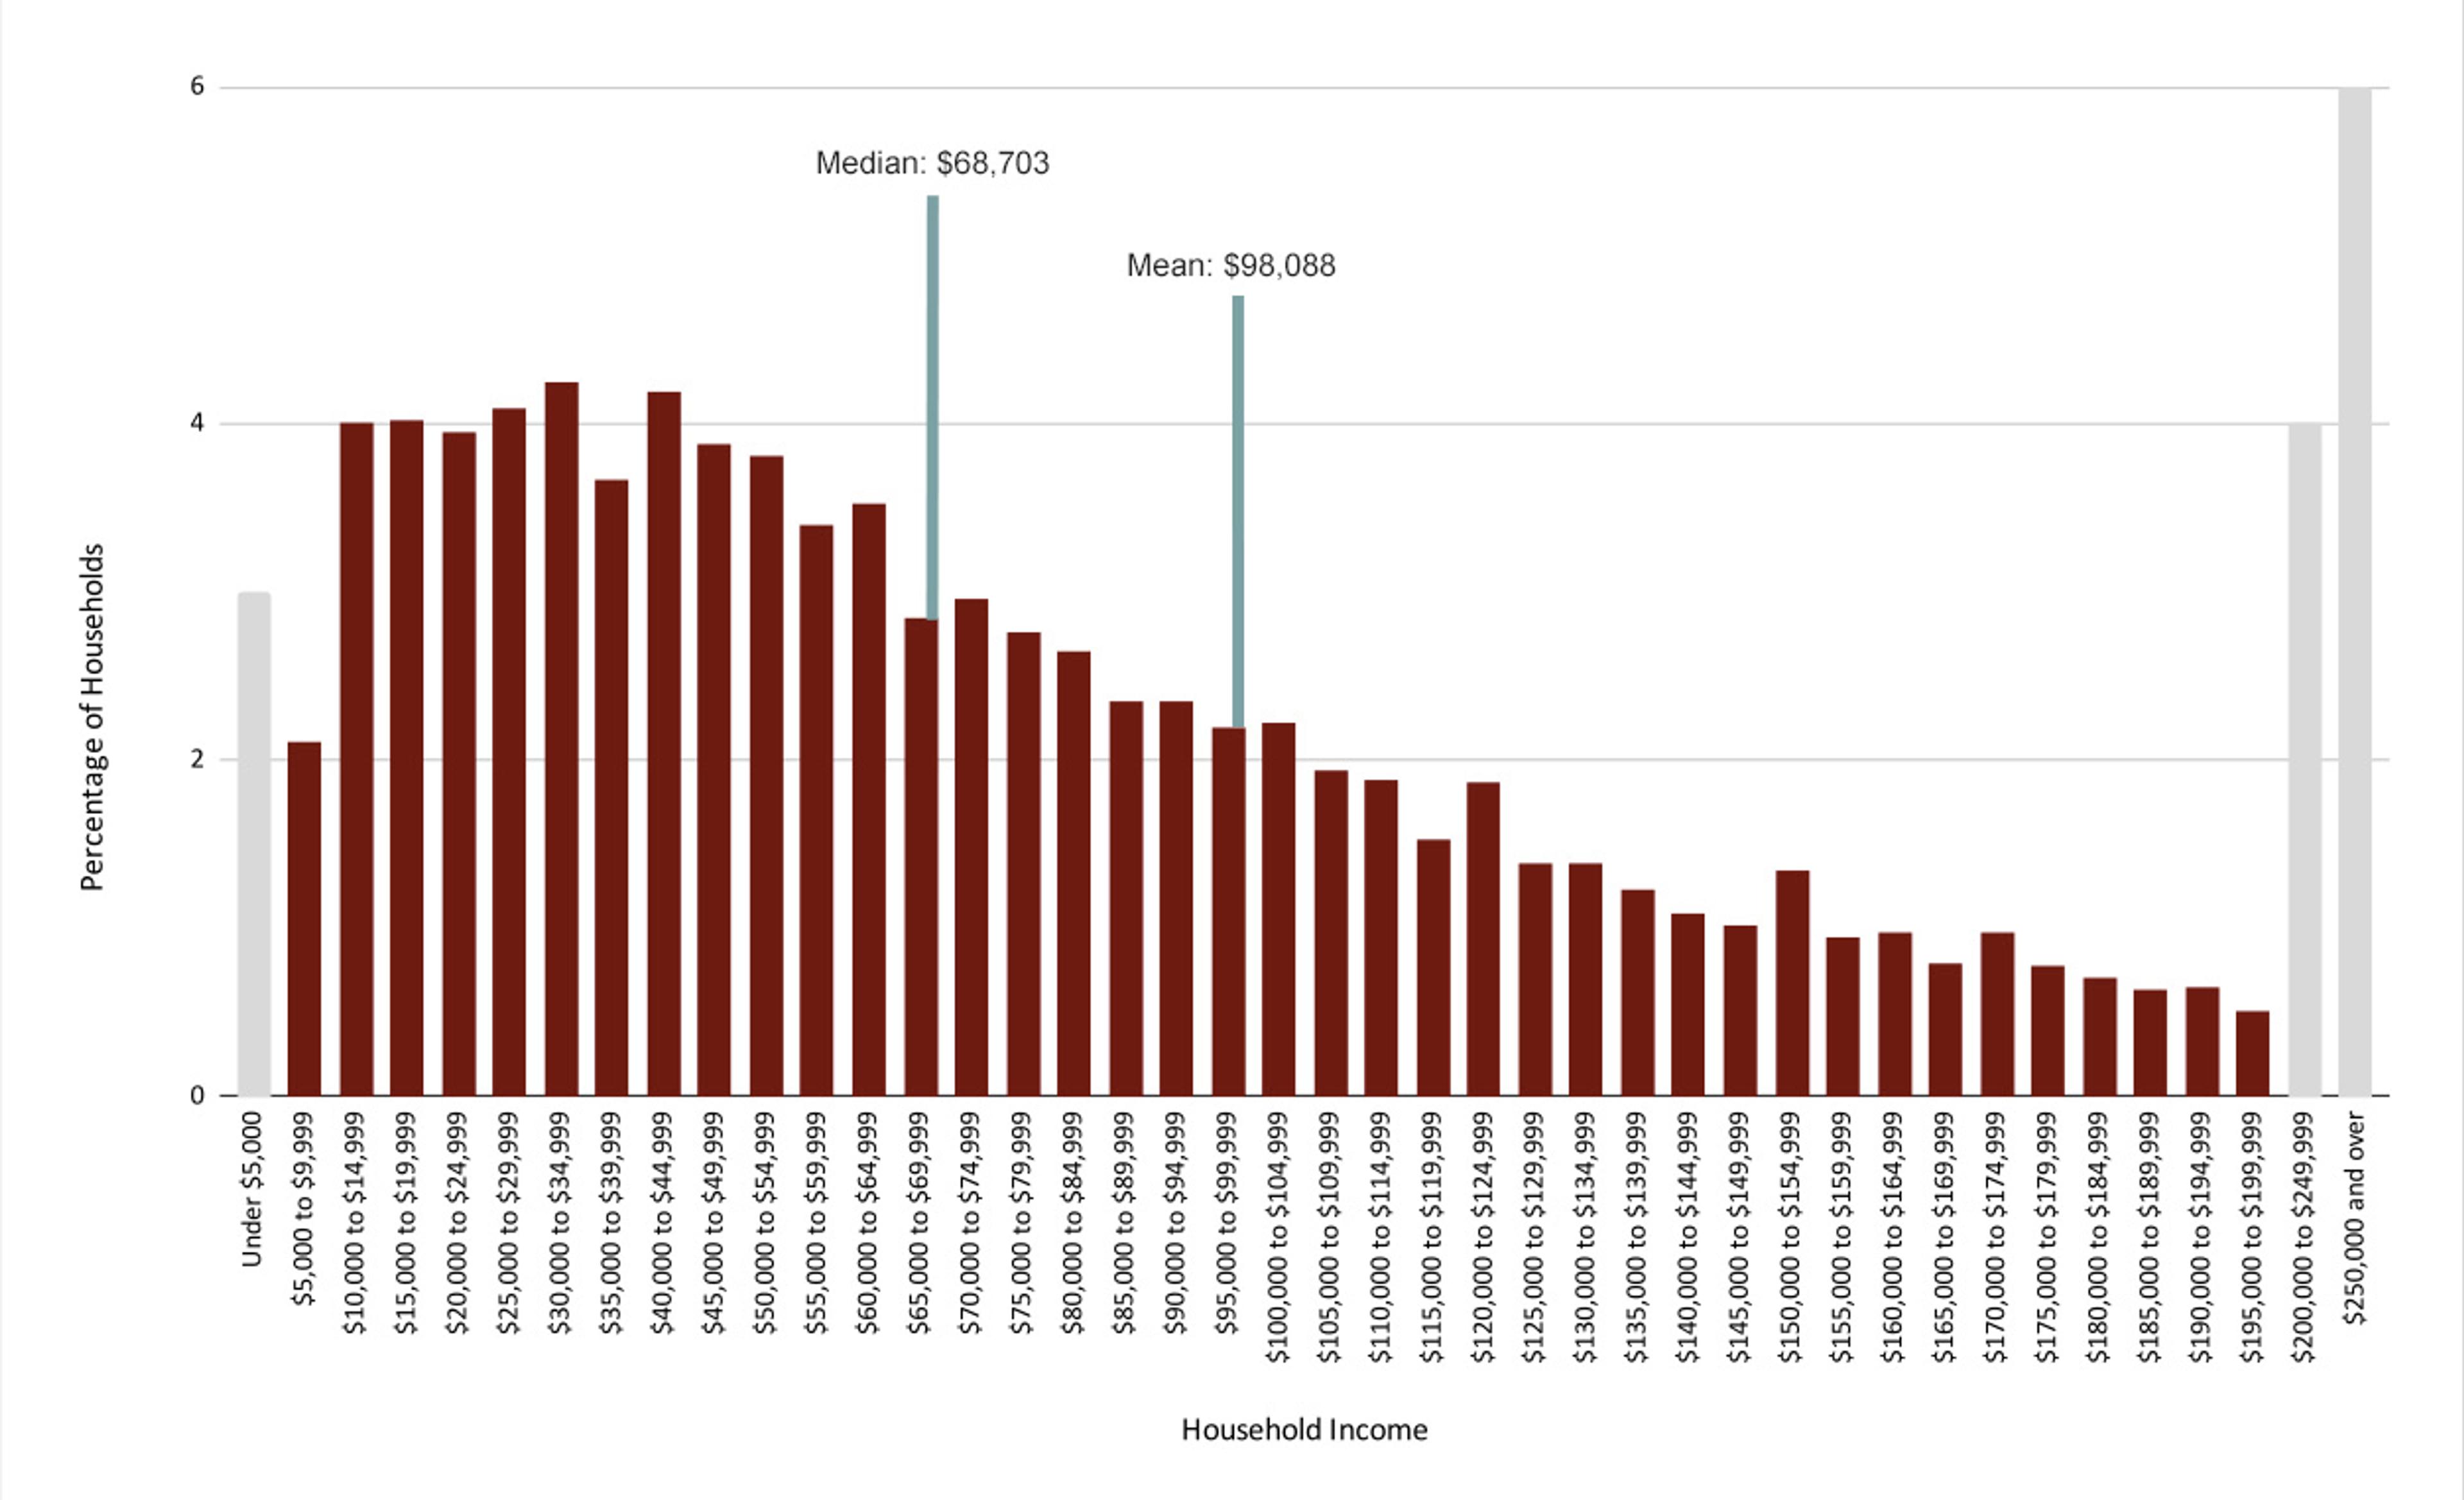
Note: The gray bars at either end of the chart represent income brackets wider than $5,000.
Data source: US Census Bureau, Annual Social and Economic Supplement (2019)
What is important to note about the chart above is the shape of the distribution. The shape indicates that many households are on the lower end of the distribution. However, it has a long "tail," indicating that a few households have very high incomes. As we saw in the island example above, the relatively small number of higher incomes affect the mean, but not necessarily the median. As a result, the mean ($98,088) is higher than the median ($68,703). In cases like this, the mean income in a country might not be very representative of its average inhabitant.
With a mean household income of $98,088 and the fifth highest GDP per capita (and the highest total GDP) in the world, one could mistakenly assume that poverty isn't much of an issue in the US. It's important, therefore, to consider the way that wealth is distributed. Both the mean and median personal and household incomes in the US dwarf those of many other countries, a key point we will visit later when we compare inequality between countries.
Inequality within countries: The Gini Index
The difference between mean and median income suggests high levels of inequality. If we want to know more about inequality, maybe we should try to measure it directly. There are several different ways to do this. One of the most widely used is the Gini Index (or "Gini coefficient").
In simple terms, the Gini Index is a measure of how equal a country's distribution of income is. It is a score between 0 and 1, where 0 represents perfect equality and 1 represents perfect inequality. Perfect equality means a country's total income is shared equally among its residents, whereas perfect inequality means a country's total income is owned by a single individual.2
You can find a database of Gini indices, as well as the mean and median incomes and a range of other measures, in the table below. For example, you can see that South Africa is (by this measure) the most unequal country in the world with a Gini index of 0.63. On the other hand, it still has roughly twice the median income of Guinea ($1,620 versus $840). The Gini index measures inequality within a country but doesn't take into account the country's overall wealth.
Inequality between countries
It is perhaps more important to consider inequality between countries. Yes, countries such as the US have cases of poverty (at a level that can be shocking given how wealthy the country is overall). Still, both the prevalence and the severity of poverty in the US is drastically lower than it is in many other countries. And thanks to the internet, we can send donations to those on the other side of the globe with a few clicks. In order to be as effective as possible, a global perspective must be taken — that way, we can be sure we are finding (and, more importantly, funding) the best opportunities to do the most good with the resources we have.
The differences in median incomes between countries can be stark. For example, the United States has a median income of $19,296 for all of its citizens (including children, retirees, and others who are not part of the labour force) and a much higher $35,977 for those who are working. Even $19,296 is enough to put one well into the wealthiest 99% in some countries. In the Central African Republic (CAR), one of the world's poorest countries, 65% of the population lives on less than $700 per year. If you earn the median US salary, it is likely that very few people in the CAR are richer than you — perhaps only a thousand or so people. That number is minuscule when you consider the fact that the country has a population of about 4.5 million people — more than the population of Los Angeles! Could you imagine being among the richest 0.02% of people in a city as big as LA?
Purchasing power parity (PPP)
You might be thinking that, while the claims in this post are true, they ignore the cost of living differences between low-income and high-income countries. Indeed the cost of living is much cheaper in the Central African Republic than in the US. Perhaps you can think back to a time you visited a large, expensive city like New York or London. Contrast this with a trip you made to a much less expensive city — a warm holiday you took in Southeast Asia, for instance. While it's true that the cost of living varies between countries, the $700 income figure already takes cost-of-living variation into account using a calculation called purchasing power parity, or "PPP."
PPP is an economic metric used to compare the prices of goods and services in different locations with different costs of living. It works as a sort of exchange rate by calculating how much a given amount of money could buy in different places. PPP is calculated using the ratio between the prices of a basket of goods (think of the typical things you buy, like food, clothing, electronics, rent, etc.) in two different countries.
For example, imagine a (heavily simplified) basket of goods containing the following items: a laptop, a 1 kg bag of lentils, a wool sweater, and a bottle of wine. Each basket costs the following in the US and Mexico:
United States:
Laptop: $500 USD
Lentils: $2 USD
Sweater: $40 USD
Wine: $10 USD
Mexico:
Laptop: 20,000 pesos
Lentils: 80 pesos
Sweater: 1600 pesos
Wine: 400 pesos
In this example, the PPP exchange rate is 40 pesos for every one dollar (quite far from the actual exchange rate of approximately 20 pesos for every one dollar).
The extent of poverty in countries like the Central African Republic can be hard to comprehend for those who live in high-income countries. What does the concept of purchasing power parity mean for someone with a $700 USD income in the CAR? It means that the cost of living has already been taken into account. That $700 figure (equivalent to $1.90 a day, which is a standard measure of poverty) is based on what $700 can buy in the US. Imagine living in the US on $700 per year. How soon would you run out of money for the bare essentials, like food, clothing, and shelter? The answer is quite quickly, as many people in low-income countries do. This is precisely why people in wealthy countries can do so much good in the world through highly effective donations to individuals who need them the most.
Your money can buy happiness for others, and at a huge discount!
These statistics are not just a morbid look at how little others have. They can be an encouraging reminder that you have a tremendous opportunity to make a difference in the lives of others, even without a significant sacrifice.
A 2013 study by two economists suggests that doubling your income, whether you make $1,000 annually or $100,000, raises your happiness by roughly the same amount.
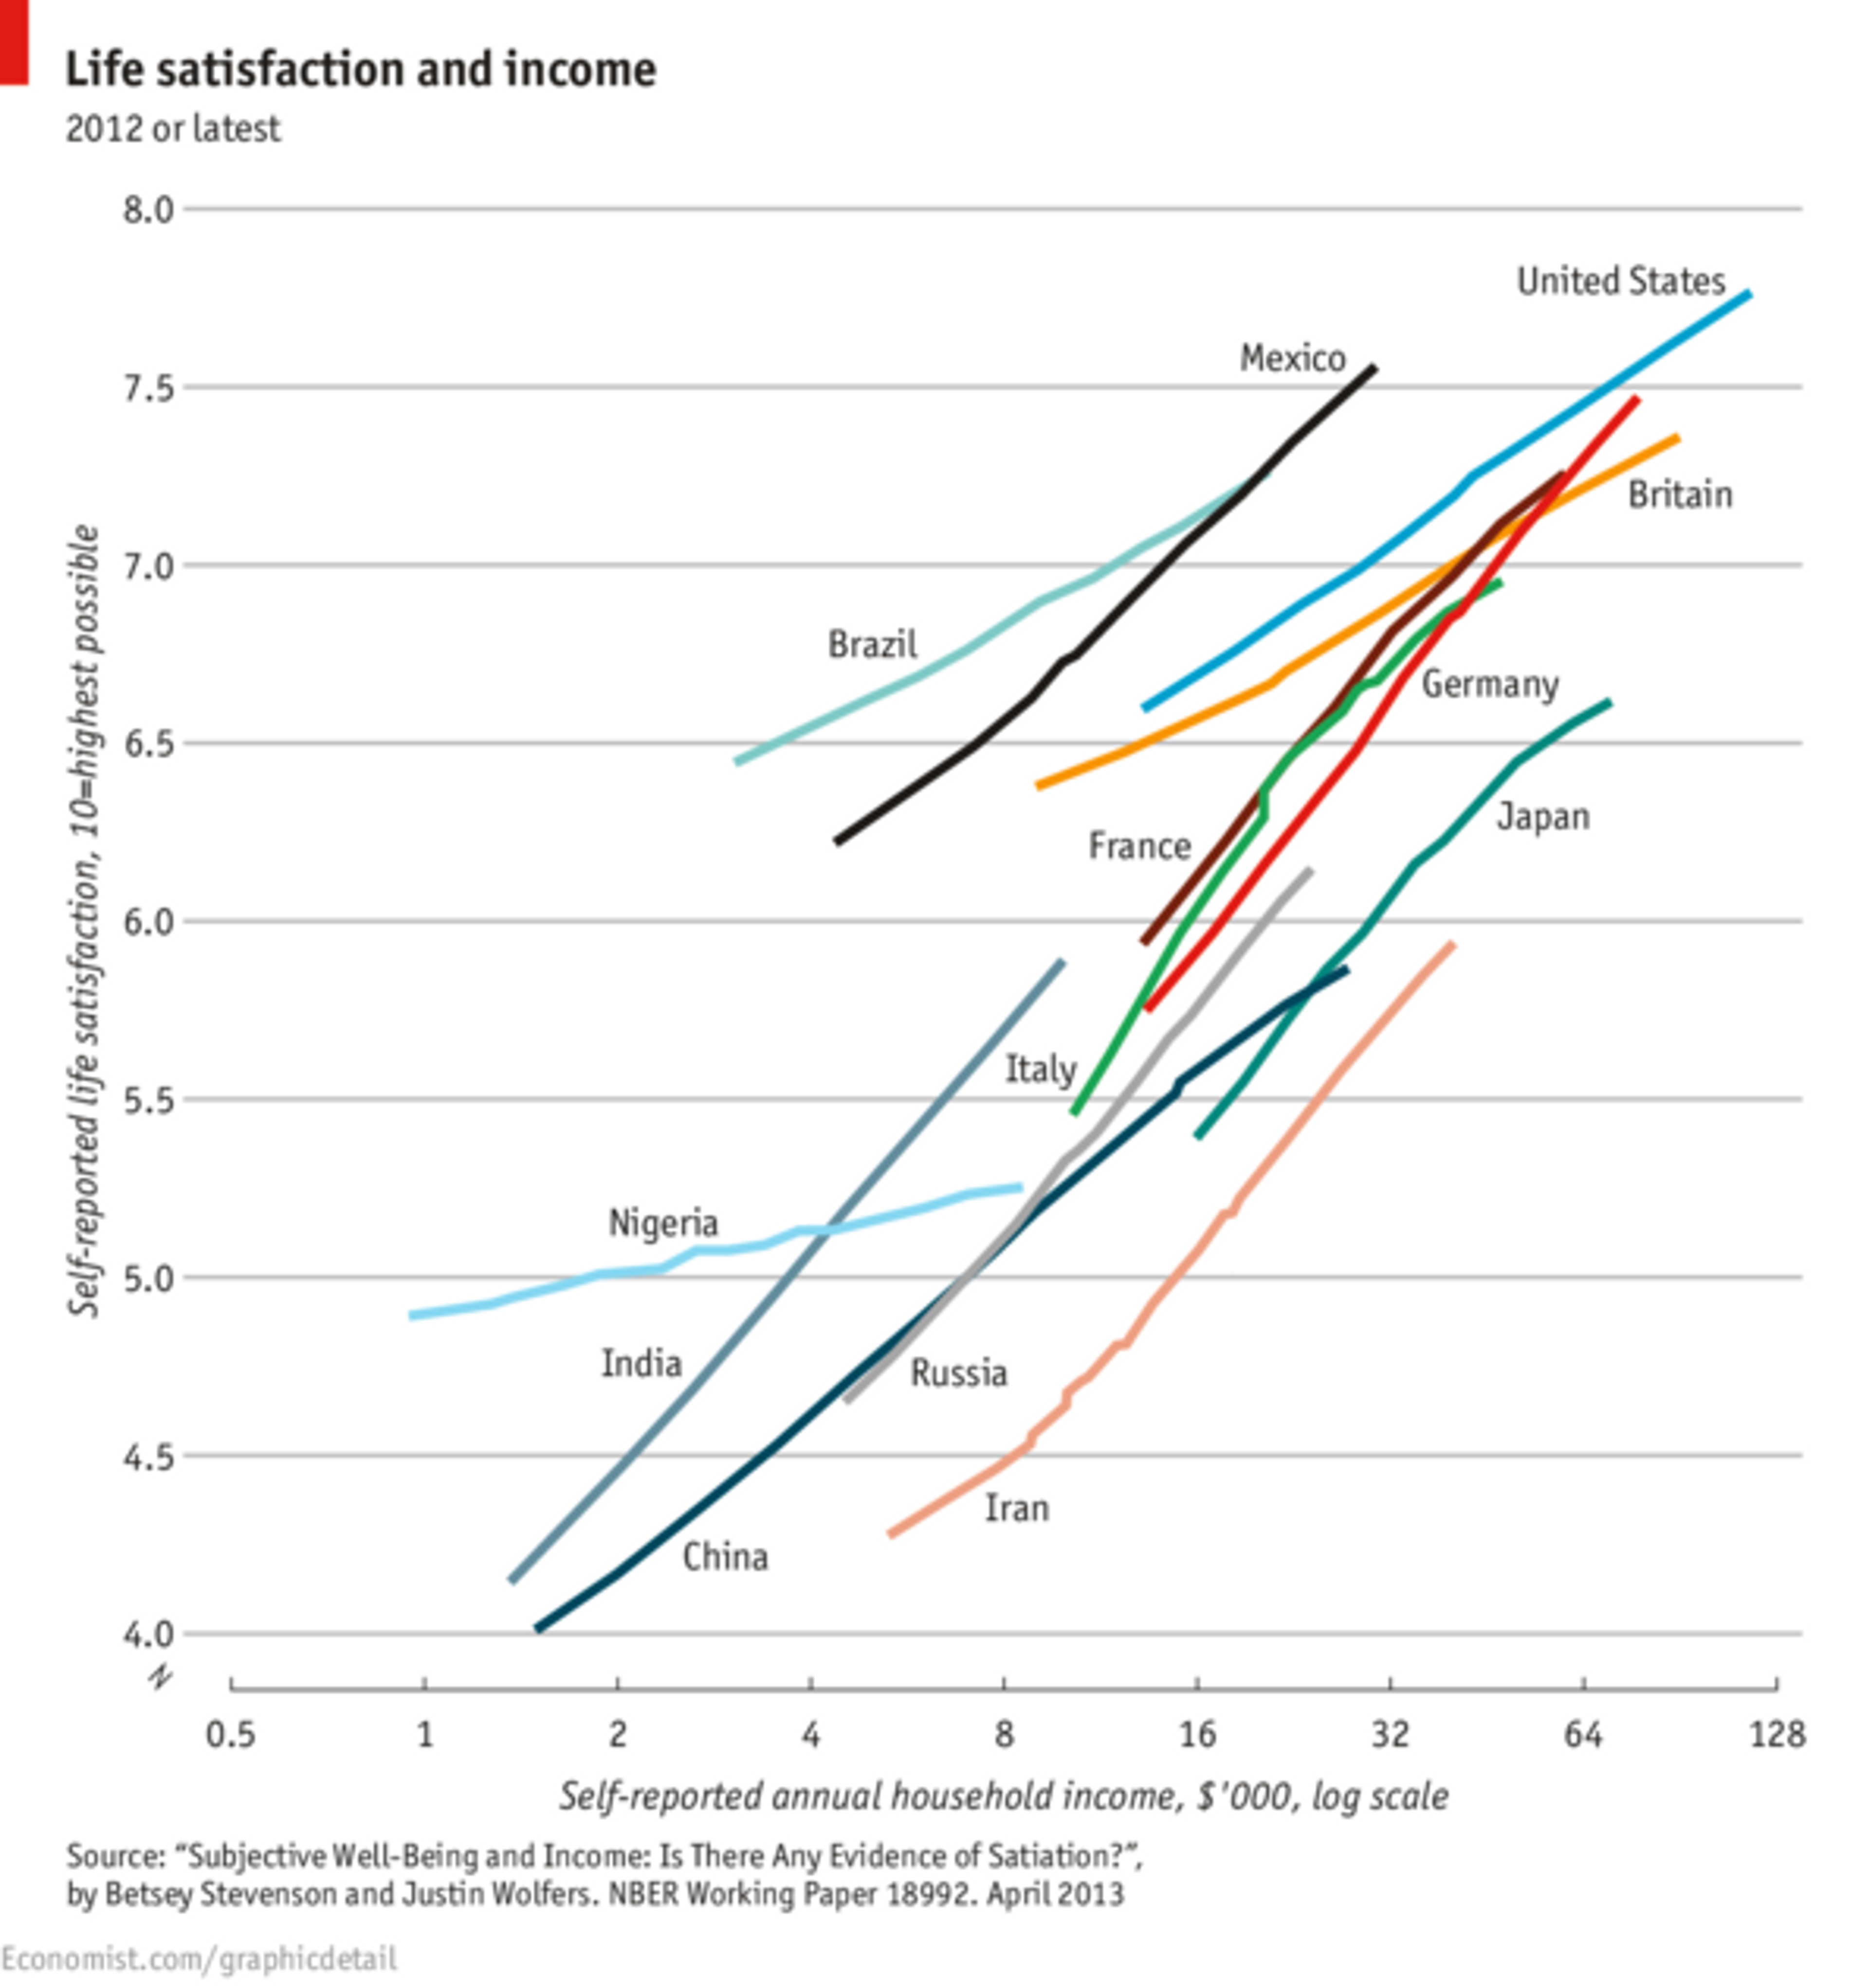
In another study (published in 2021), the author used a smartphone app to periodically ask a large sample of people with varying incomes how they felt throughout the day. It arrives at a similar conclusion to the 2013 study.
So, $35,000 can raise the happiness of one person earning $35,000 by the same amount as it can for 50 people who earn $700 annually. That difference is staggering, especially because other global health interventions, such as insecticide-treated mosquito nets and parasitic worm medication, can be as much as 15x more effective than direct cash transfers!
Will MacAskill, a cofounder of Giving What We Can and a leading figure in the effective altruism movement, explains this idea with an analogy in his book Doing Good Better:
"Imagine a happy hour where you could either buy yourself a beer for five dollars or buy someone else a beer for five cents. If that were the case, we'd probably be pretty generous — next round's on me!"
MacAskill calls this idea the 100x multiplier: with each dollar spent, those who live in wealthy countries can expect to do at least one hundred times as much to benefit those in low-income countries than to benefit themselves.
Final thoughts
Poverty — what causes it, how to measure it, and how to solve it — can be remarkably complex. There is no one size fits all measure we can use. What is important to understand from this article is that a single metric doesn't necessarily tell a complete picture and that different measures should be used in different circumstances. And when thinking about what you can do in light of global poverty, think of two key questions:
- Am I in a position to help others with my resources?
- If so, how can I use my resources to help others as much as possible?
If you live in a high-income country, there is a good chance that the answer to the first question is a resounding "yes." By pledging to donate 10% of your income throughout your career (regardless of whether you're extremely wealthy or not) you can save many lives and improve the wellbeing of thousands of others, all without significant cost to yourself. Imagine what it would feel like to save a child's life, say one that is drowning in the ocean. That moment would stick with you for the rest of your life — you would rightfully be called a hero! But what if you could save lives every single year? Well, you might be able to do just that, especially by thinking carefully about income inequality and the power of your donor dollars.
Further reading
- Find out how rich you are compared to the rest of the world with the "How Rich Am I?" calculator.
- Visit Our World in Data to learn more about economic inequality.
- Learn about our giving pledges and consider donating to the world's most effective charities.
Appendix
Countries by GDP per capita (PPP), mean income (PPP), median income (PPP), Gini Index, and % below poverty line3
You can filter and rank countries listed by GDP, income and poverty metrics using the interactive table below. All income values are in current international dollars ($Int) as of 2020.
Fast facts
- The median GDP per capita (PPP) of the world's countries is $12,609 (halfway between Bhutan at $12,356 and Mongolia at $12,862).
- The US has the sixth highest GDP per capita (PPP), fourth highest mean income, and fifth highest median income.
- One hundred and twenty-one countries are lower than the US on the Gini Index (meaning they have greater equality).
- In the US, <1% of the population are living below the international poverty line ($1.90 per day).
- As of 2020, the World Bank estimates that 703--729 million people live below the international poverty line.
- The per capita GDP of the United States is $65,298 (current $Int, PPP).
- The highest GDP per capita is Luxembourg at $124,591 (current $Int, PPP).
- The lowest GDP per capita country is Burundi at $785 (current $Int, PPP).
- The highest median income country is Luxembourg at $31,377 (current $Int, PPP).
- The lowest median income country is the Democratic Republic of Congo at $549 (current $Int, PPP).
- The global GDP per capita, or world GDP per capita, is $17,811 (current $Int, PPP).
- The five countries with the highest GDP per capita are Luxembourg ($31,377), United Arab Emirates ($27,017), Norway ($25,273), Switzerland ($25,788), United States ($25,332).
This article is a followup to a 2016 blog post on giving and global inequality written by Hauke Hillebrandt.