Relatively wealthier countries certainly spend a lot of money on developing world [1] aid. But how much money is being moved? And by whom? If we’re interested in understanding and influencing aid spending, it’s important to know how it’s distributed and where it comes from.
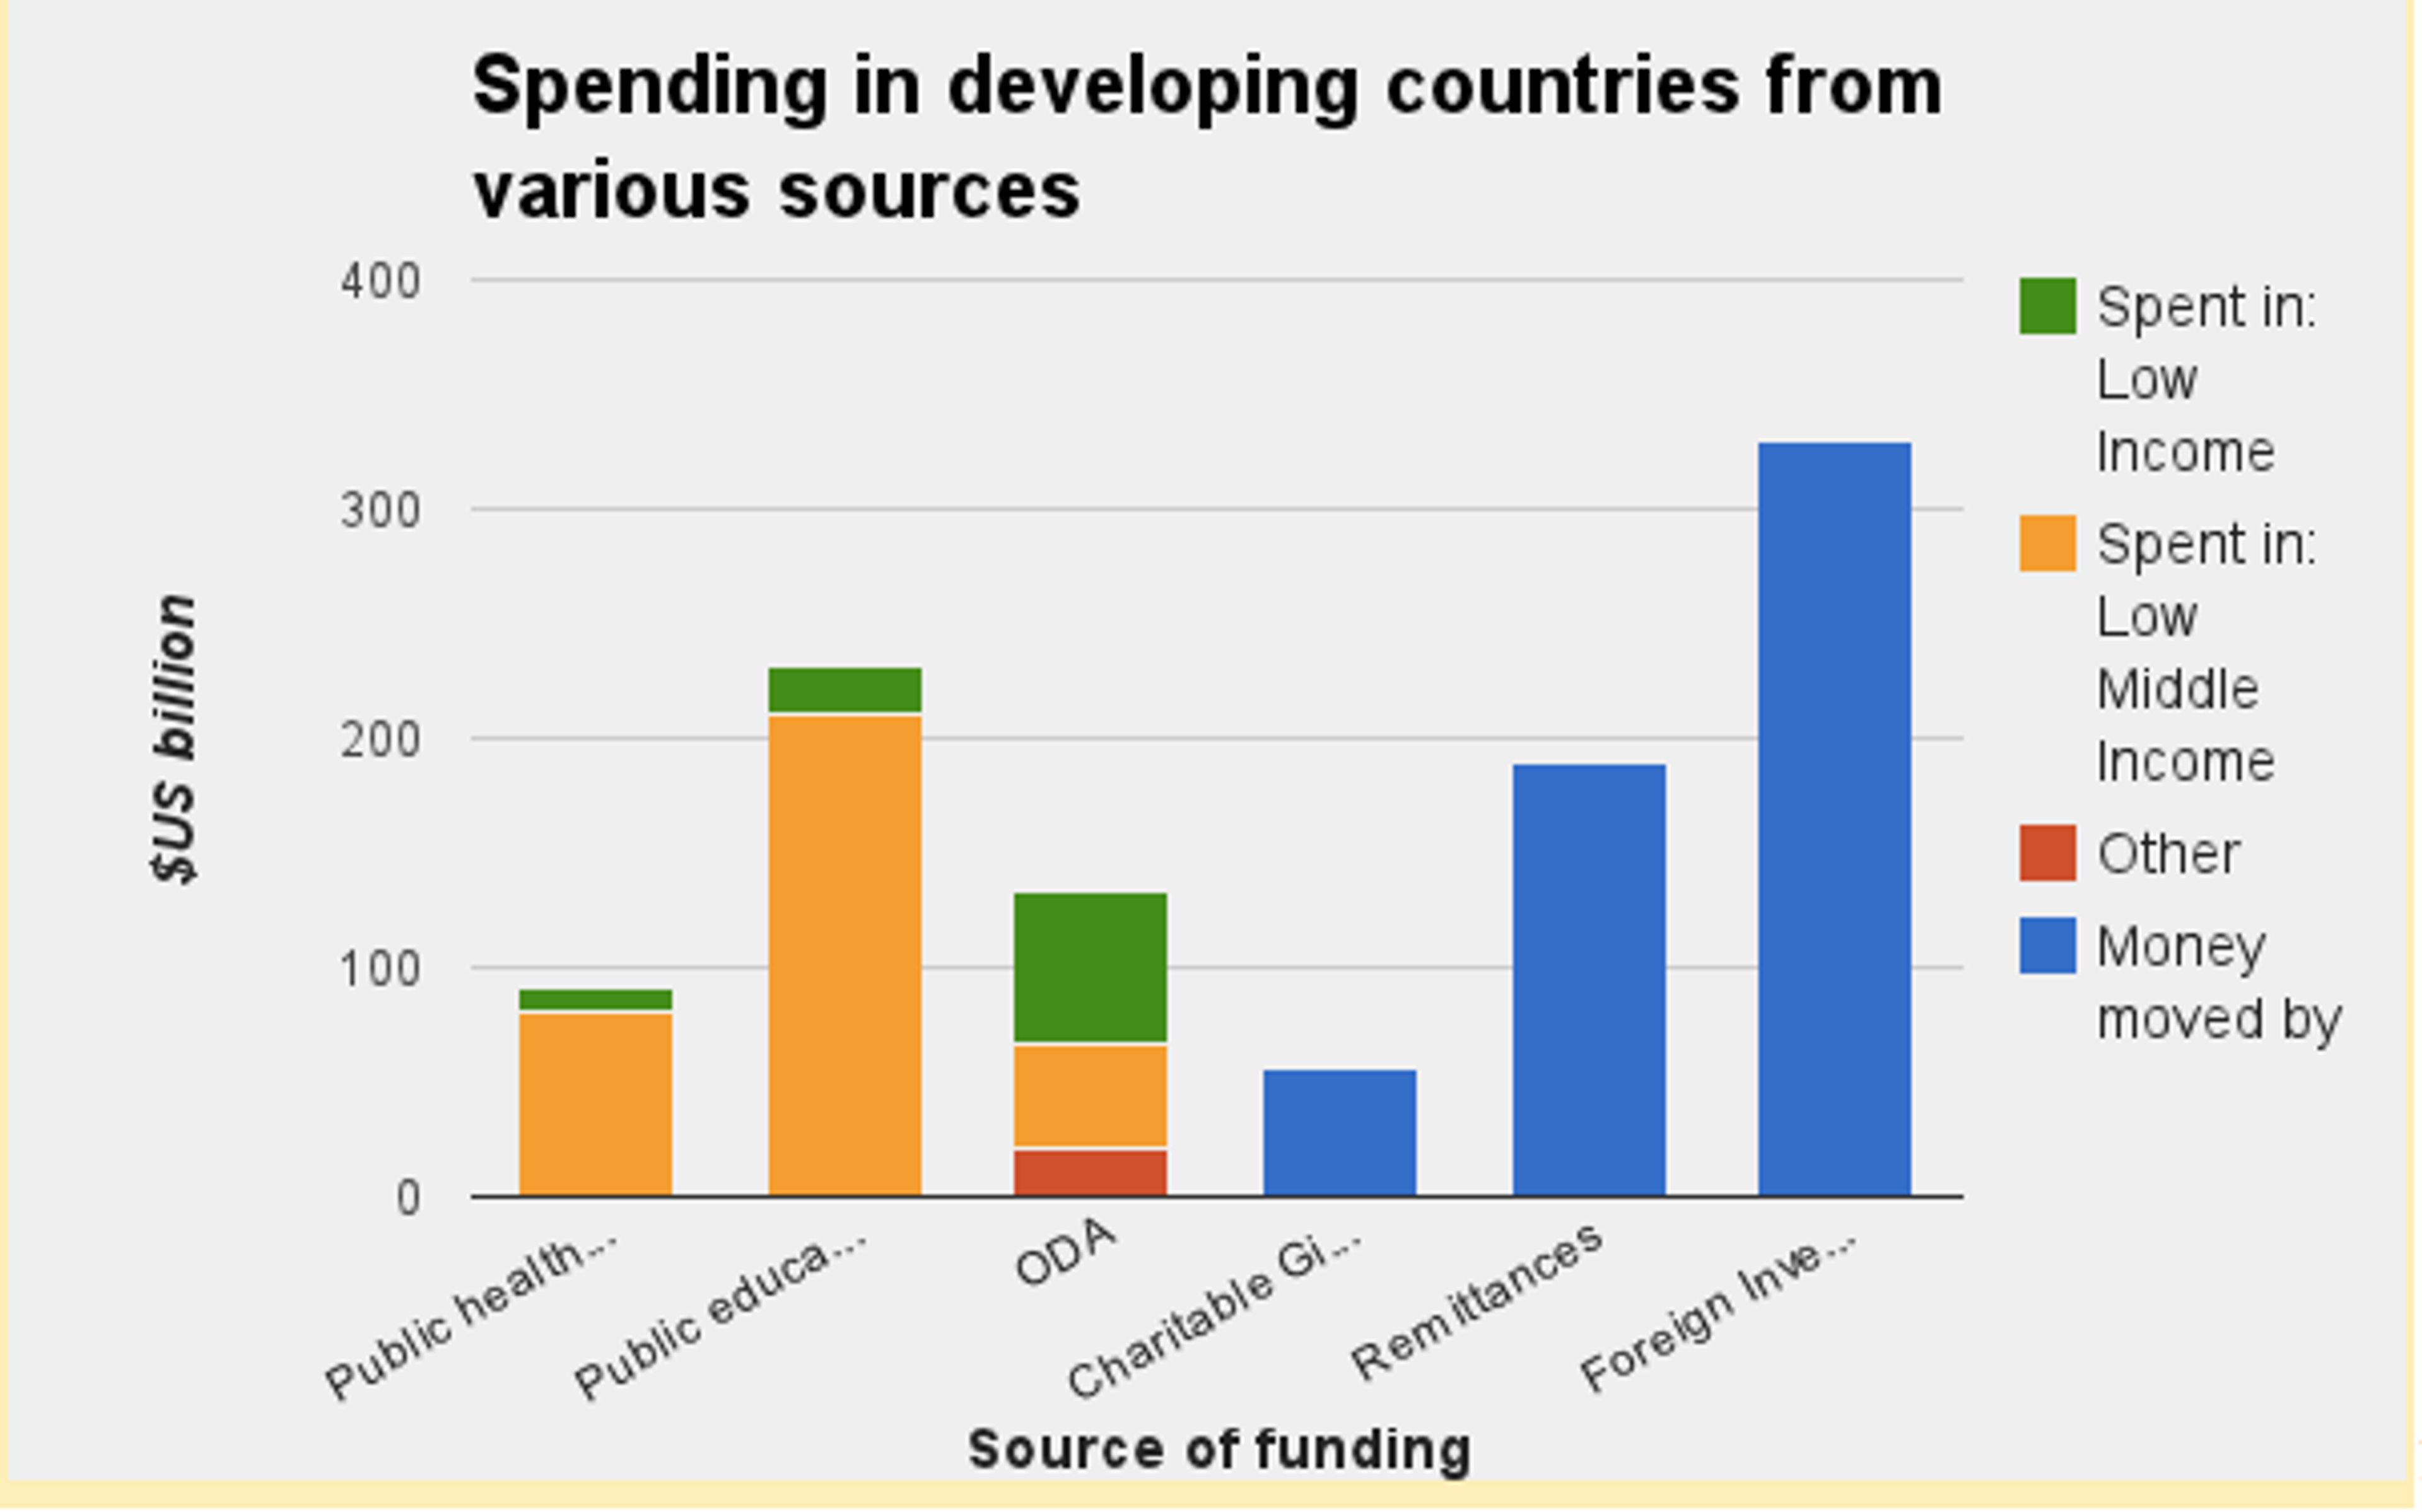
Figure 1 shows spending on public health and public education, as well as money moved by Official Development Assistance [2], charitable giving, remittances (money sent back home by migrant workers), and foreign investment (money invested in developing world companies).
The green and orange columns refer to spending (either in aid or from the governments themselves) in Low Income Countries (LI) [3] and Lower Middle Income Countries (LMI) [4] respectively. The red column refers to spending in higher income countries and is available for Official Development Aid (ODA) data, but not for any of the others. Blue columns are columns for which information on income is unavailable.
Data reported in the first three columns refer to year 2011 (most recent comparable year). Data in columns four, five and six from ‘The Index of Global Philanthropy and Remittances 2012’ refer to the year 2010. They are expressed in current USD and thus are not adjusted for Purchasing Power Parity (PPP).
PPP is a ratio that expresses the amount of good or services that one USD can buy in different countries which makes the figures comparable even if they are spent in different places. However, at the present time data required to do this adjustment were not available. Note that figures in USD will tend to underestimate the real value of the services provided in the poorest countries because services like education and health cost less to provide there.
Overall, in 2011, spending on public health was $92bn and spending on education was $231bn. Significantly more money was spent in LMI countries than LI countries. This is because much of the money in public health and education is spent by the countries themselves, and LMI countries have more money to spend -- with higher GDP per capita and, in the case of India, enormous population.
Official Development Assistance (ODA)
ODA is defined as disbursement of loans and grants made on “concessional terms”, or terms at which the ODA nations will overall lose money and don’t stand to gain any profit [5]. For example, ODA assistance must include at least 25% in grants (money given with no expectation that it be later returned).
ODA has provided $134bn in aid over 2011, of which $42.6bn went to LI countries and $37.3bn to LMI countries. ODA spending is therefore larger than spending on public health in LMI and LI countries and furthermore is the majority of all spending in LI countries. However, as described in the Department for International Development report “Aid for the Poorest?” [6], ODA does not focus on the poorest countries as much as one would expect.
Charity
Research from The Center for Philanthropy at Indiana University [7] found that the United States represents the largest charitable sector in the world, at least in terms of absolute amount of dollars given. About 2% of US GDP was donated, representing $298.42B. However, according to this report, only 8% of this total, or around $22.68B (8% of donations), went to “international causes”, with 32% of donations being given to religious charities, 13% given to education in the US, 8% to health in the US, 3% given to environmental and animal organizations, and 36% being given to other causes.
Another report from the 2012 Index of Global Philanthropy and Remittances [8] calculated that the US actually spends $39bn on the developing world, with 36% coming from private and voluntary organizations, 19% coming from corporations, 18% coming from religious organizations, 12% coming from foundations, 10% coming from volunteering, and 5% coming from universities and colleges.
Remittances
Remittances are transfers of income across borders, sent back home by friends or family working abroad. They are a very significant source of cash flow into the developing world - at $190bn, they represent more than six times charitable spending.
This can be seen as an argument for the importance of opening up opportunities for migration in order to get more money into the developing world. Unfortunately, the poorest of the poor are unlikely to be able to migrate and therefore will never benefit from remittances, so this cannot be the complete solution for poverty.
Foreign Investment
The largest flow of money into the developing world was investment in developing world companies from foreign investors, topping out at $329bn. This was not always the case, and can arguably be read as a hopeful sign for the future economic growth of developing countries.
Conclusion
Overall, breaking down the spending in the developing world has interesting implications for foreign aid. When we imagine the trillions of dollars in aid money that have been spent over the past half century, we don’t really imagine that not all that much of it is going to those who need it the most -- the poorest of the poor. This shows that, from a humanitarian perspective, there is plenty of potential to improve investment in the developing world.
But, perhaps most importantly, it shows the scope of charitable giving. There isn’t a whole lot of giving to the developing world relative to the total amount of charitable giving. But it still stacks up quite well, being only less than half of ODA. Thus, charitable giving has an important role to play. And we should continue to shape this role by encouraging more, and more effective, giving to the developed world.